Welcome to the TCCIA!
TCCIA (The Cancer CircRNA Immunome Atlas) is an extensive and user-friendly database designed to help researchers explore the role of circular RNAs (circRNAs) in cancer immunotherapy.
CircRNAs are a type of RNA that form a closed loop structure, and they have been shown to play important roles in regulating gene expression. TCCIA offers the first online platform for studying circRNA expression and analysis in 25 cohorts of patients receiving immunotherapy targeting CTLA4, PD-1, or PDL-1, among other targets. This innovative resource provides systematic comparisons between circRNAs, clinical phenotypes, and immune signatures/infiltration at both the cohort and molecular levels. The database includes over 4000 cancer samples from 10 types of cancer patients who have been treated with Immune Checkpoint Inhibitors (ICIs) alone or in combination with other modalities, including chemotherapy, targeted therapy, and other immunotherapy agents.
TCCIA represents a unique opportunity to study circRNAs and their potential as biomarkers for predicting response to immunotherapy, as well as their broader functions in cancer. Whether you are a researcher studying circRNAs or a clinician interested in improving patient outcomes with new therapeutic strategies, TCCIA provides valuable insights into the complex interplay between circRNAs, the immune system, and cancer.
Pre-R or Pre-NR, patient pre-treatment sample with response or nonresponse; On-R or On-NR, patient on-treatment sample with response or nonresponse; NE (or Null) for not available.
Multiple arms may exist in clinical cohorts. To remove confusion, by default, only immunotherapy-related samples are included in analysis modules. However, you can disable it on the 'Setting' page for more advanced filter and analysis.
Features
TCCIA provides multiple features for interacting with the underlying data sources, including picking up one or more cohorts of interest, exploring CircRNA distribution among multiple cohorts, analyzing survival prognosis for CircRNA(s), finding out CircRNA(s) highly expressed in immunotherapy response group, etc.
Repository
Here is an overview of all cohorts currently available in the database along with filter widgets. The selection of a or more cohorts on this page is the first step for users to proceed.
View >>>Browser
TCCIA provides the link between the CircRNA Location used in TCCIA with various database-named CircRNA IDs
View >>>Cohort-centred Analysis
Explore a single cohort with multiple functionalities, including checking the correlation between CircRNAs, testing the abundance changes of a CircRNA between different conditions, and studying whether one or multiple CircRNAs have prognostic value.
View >>>Molecule-centred Analysis
Explore CircRNAs (distribution, prognosis) across multiple cohorts.
View >>>Signature
Visualize the correlation between one or more CircRNAs and tumor microenvironment measures or tumor molecular signatures (derived from IOBR package) in one or more cohorts.
View >>>DE circRNAs
View the differential expression CircRNA list for immunotherapy responsive and non-responsive patients, and display the data through a volcano plot.
View >>>Gallery
Release Notes
2023-11-10: release of TCCIA v1.0.
2023-09 - 2023-10: work on major revision
2023-06-14: update UI and survival analysis
2023-05-28: release v1.0 beta for public test
Citation
intro
On the 'Browse' page, we associate the CircRNA Location used in TCCIA with various database-named CircRNA IDs you are familiar with. You can filter genes or location information of interest on the page to obtain their corresponding CIRCpedia or CircAtlas IDs. Additionally, through the Converter's CircRNA ID conversion function, based on the powerful CircAtlas database 3.0, you can input IDs from databases such as circBase, circRNADb, deepbase2, and more, to obtain the corresponding CIRCpedia or CircAtlas IDs. This enables you to retrieve CircRNA Location information in the Browse section for downstream analysis.
CircRNA Browser
ID Converter
intro
The 'Repository' page provides an overview of the cohorts and datasets included in the TCCIA. It offers multiple ways to filter and select cohort(s) for analysis. Remember, you need to check the box on the left of your preferred cohort(s) to make the selection. This ensures that the cohort and its corresponding datasets can be found in the analysis modules.
intro
The functional modules presented on this page are designed to help users explore CircRNAs in a single immunotherapy cohort. All selectable datasets are obtained from cohorts that you choose on the 'Repository' page. When selecting different datasets in some of the modules on this page, make sure that they are from the same cohort; otherwise, a box will typically pop up reminding you about this.
Note: Reading the papers the cohorts derived from is highly recommended. Some cohorts may have complex designs, which means that the phenotype data could include samples taken both before and after therapy (stored in the 'Response2' column) or samples with different treatments. By default, only immunotherapy-related samples are included. However, you can check the 'Setting' page for control. When using the data, please ensure that it meets your requirements and filter the data if necessary using the options available on the right panel.
Analysis Controls
Switching analysis type may take some time to update the available IDs
Switching analysis type may take some time to update the available IDs
Filter & Output
Filter:
By default, only immunotherapy-related samples are included. However, you can disable it on the 'Setting' page for more advanced filter and analysis.
Output:
Analysis Controls
Switching analysis type may take some time to update the available IDs
Filter & Output
Filter:
By default, only immunotherapy-related samples are included. However, you can disable it on the 'Setting' page for more advanced filter and analysis.
Output:
Analysis Controls
Switching analysis type may take some time to update the available IDs
Filter & Output
Filter:
By default, only immunotherapy-related samples are included. However, you can disable it on the 'Setting' page for more advanced filter and analysis.
Output:
Analysis Controls
Switching analysis type may take some time to update the available IDs
Switching analysis type may take some time to update the available IDs
Filter & Output
Filter:
By default, only immunotherapy-related samples are included. However, you can disable it on the 'Setting' page for more advanced filter and analysis.
Output:
Analysis Controls
Switching analysis type may take some time to update the available IDs
Filter & Output
Filter:
By default, only immunotherapy-related samples are included. However, you can disable it on the 'Setting' page for more advanced filter and analysis.
Output:
Analysis Controls
Switching analysis type may take some time to update the available IDs
Note: not all covariates are available for the chosen dataset.
Filter & Output
Filter:
By default, only immunotherapy-related samples are included. However, you can disable it on the 'Setting' page for more advanced filter and analysis.
Output:
intro
The functional modules presented on this page are designed to help users explore CircRNAs across multiple immunotherapy cohorts. At default, only one cohort is selected. You may want to choose more cohorts on the 'Repository' page before exploring modules of this page. If you want to explore and analyze a specific cohort, please go to the 'Cohort-centred Analysis' page (although it may also work here). All selectable datasets are obtained from cohorts that you choose on the 'Repository' page.
Please note that not all cohorts share same CircRNAs, so it is expected that the modules only show part of queried datasets.
The selection of more datasets would result in fewer circRNAs available for analysis. Loading, integrating, and analyzing multiple datasets can be time-consuming, especially during high traffic periods. We appreciate your patience while using the website.
Analysis Controls
Switching analysis type may take some time to update the available IDs
Note: not all cohorts have subgroup variable data.
Filter & Output
Filter:
By default, only immunotherapy-related samples are included. However, you can disable it on the 'Setting' page for more advanced filter and analysis.
Output:
Analysis Controls
Switching analysis type may take some time to update the available IDs
Filter & Output
Filter:
By default, only immunotherapy-related samples are included. However, you can disable it on the 'Setting' page for more advanced filter and analysis.
Output:
Analysis Controls
Switching analysis type may take some time to update the available IDs
Filter & Output
Filter:
By default, only immunotherapy-related samples are included. However, you can disable it on the 'Setting' page for more advanced filter and analysis.
Output:
Analysis Controls
Switching analysis type may take some time to update the available IDs
Filter & Output
Filter:
By default, only immunotherapy-related samples are included. However, you can disable it on the 'Setting' page for more advanced filter and analysis.
Output:
intro
This module provides functionality for visualizing the correlation between one or more CircRNAs and tumor microenvironment measures or immune signatures in one or more cohorts. All selectable datasets are obtained from cohorts that you choose on the 'Repository' page.
Analysis Controls
Switching analysis type may take some time to update the available IDs
Filter & Output
Filter:
By default, only immunotherapy-related samples are included. However, you can disable it on the 'Setting' page for more advanced filter and analysis.
Output:
intro
This module provides functionality for viewing differentially expressed circRNA list for immunotherapy responsive and non-responsive patients, and displaying the data through a volcano plot. All selectable cohorts are obtained from the 'Repository' page. Please note some cohorts have no response information. For some cohorts with response data, patients with NE (could not be evaluated) or similar response evaluation have been treated as non-responsive patients for differential expression analysis.
intro
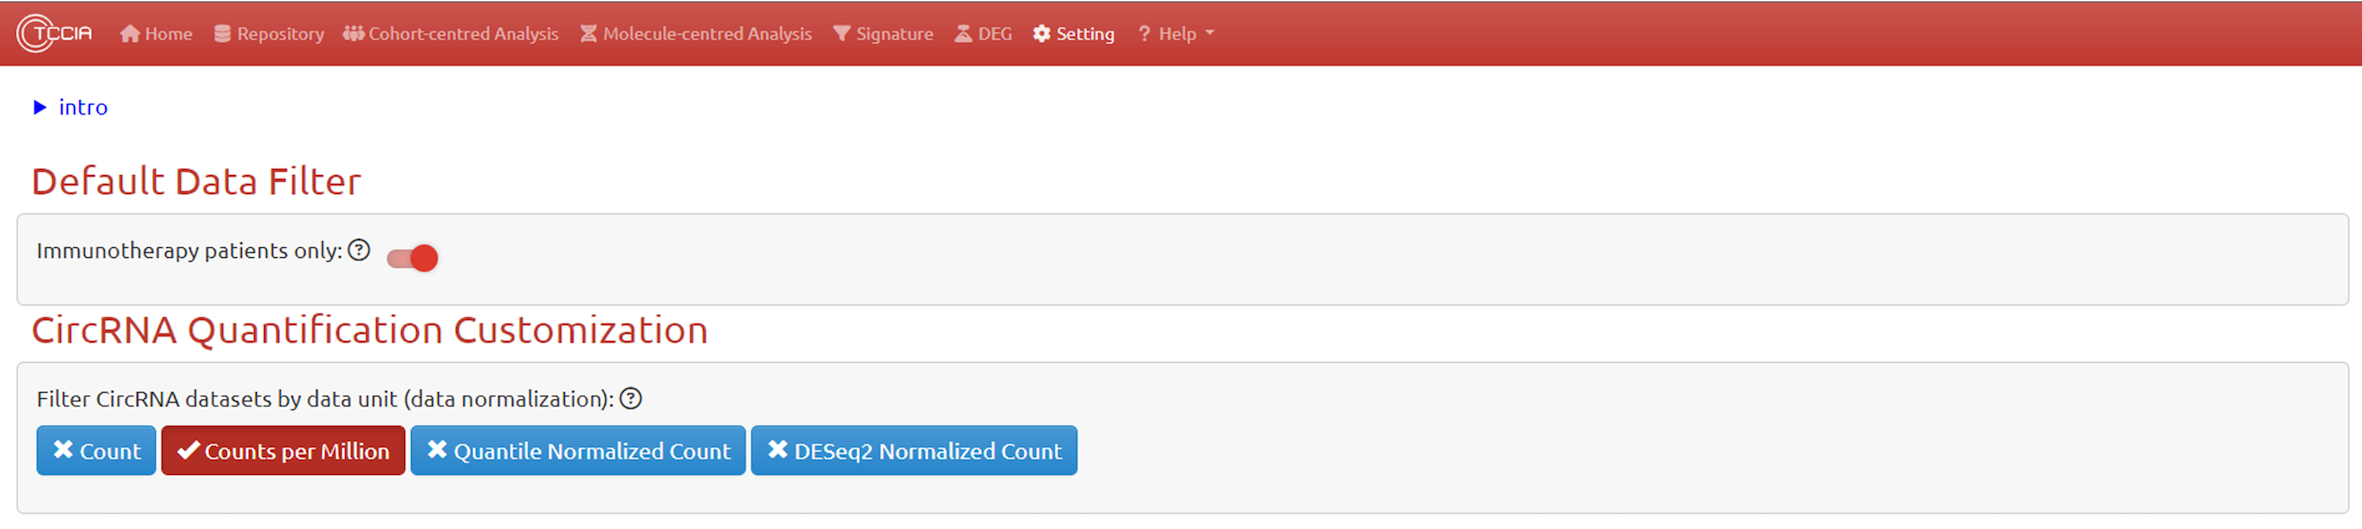
This page provides global options for controlling access to underlying data. By setting default options, we try to minimize the user's initial learning cost and ensure that the results displayed on the website are biologically meaningful. For example, we only analyze sample data related to immunotherapy by default, in order to match the core goals of our website, and to remove data bias (confusion caused by different treatments in the data) that first-time users may not see. In addition, we have set up default configuration for circRNA expression using appropriate CPM quantification. Users can adjust these global options according to their own needs after becoming familiar with the website, in order to facilitate exploring more possibilities of this website.
Default Data Filter
CircRNA Quantification Customization
Usage
- Overview
- 1. Home Page
- 2. Repository Page
- 3. Cohort-centred Page
- 4. Molecular-centred Page
- 5. Signature Page
- 6. DE circRNAs Page
- 7. Global Setting Page
Overview
TCCIA (The Cancer CircRNA Immunome Atlas) is the first database that combines circRNA profiles and immunotherapy response data for five cancer types, including over 4,000 clinical samples from 25 cohorts treated with immune-checkpoint blockades (ICBs) including PD-1/PD-L1 and CTLA-4 inhibitors, and other treatments.
A video showing how to operate the TCCIA has been given at the YouTube and the bilibili.
1. Home Page
This page gives you a quick overview of this tool, which includes:
- basic information and statistics.
- feature overview.
- gallery of supported modules.
2. Repository Page
The repository page allows users to select cohorts for further analysis.
Repository page shows multiple filters on the left panels and a cohort table (with collapsing dataset details) on the main panel.
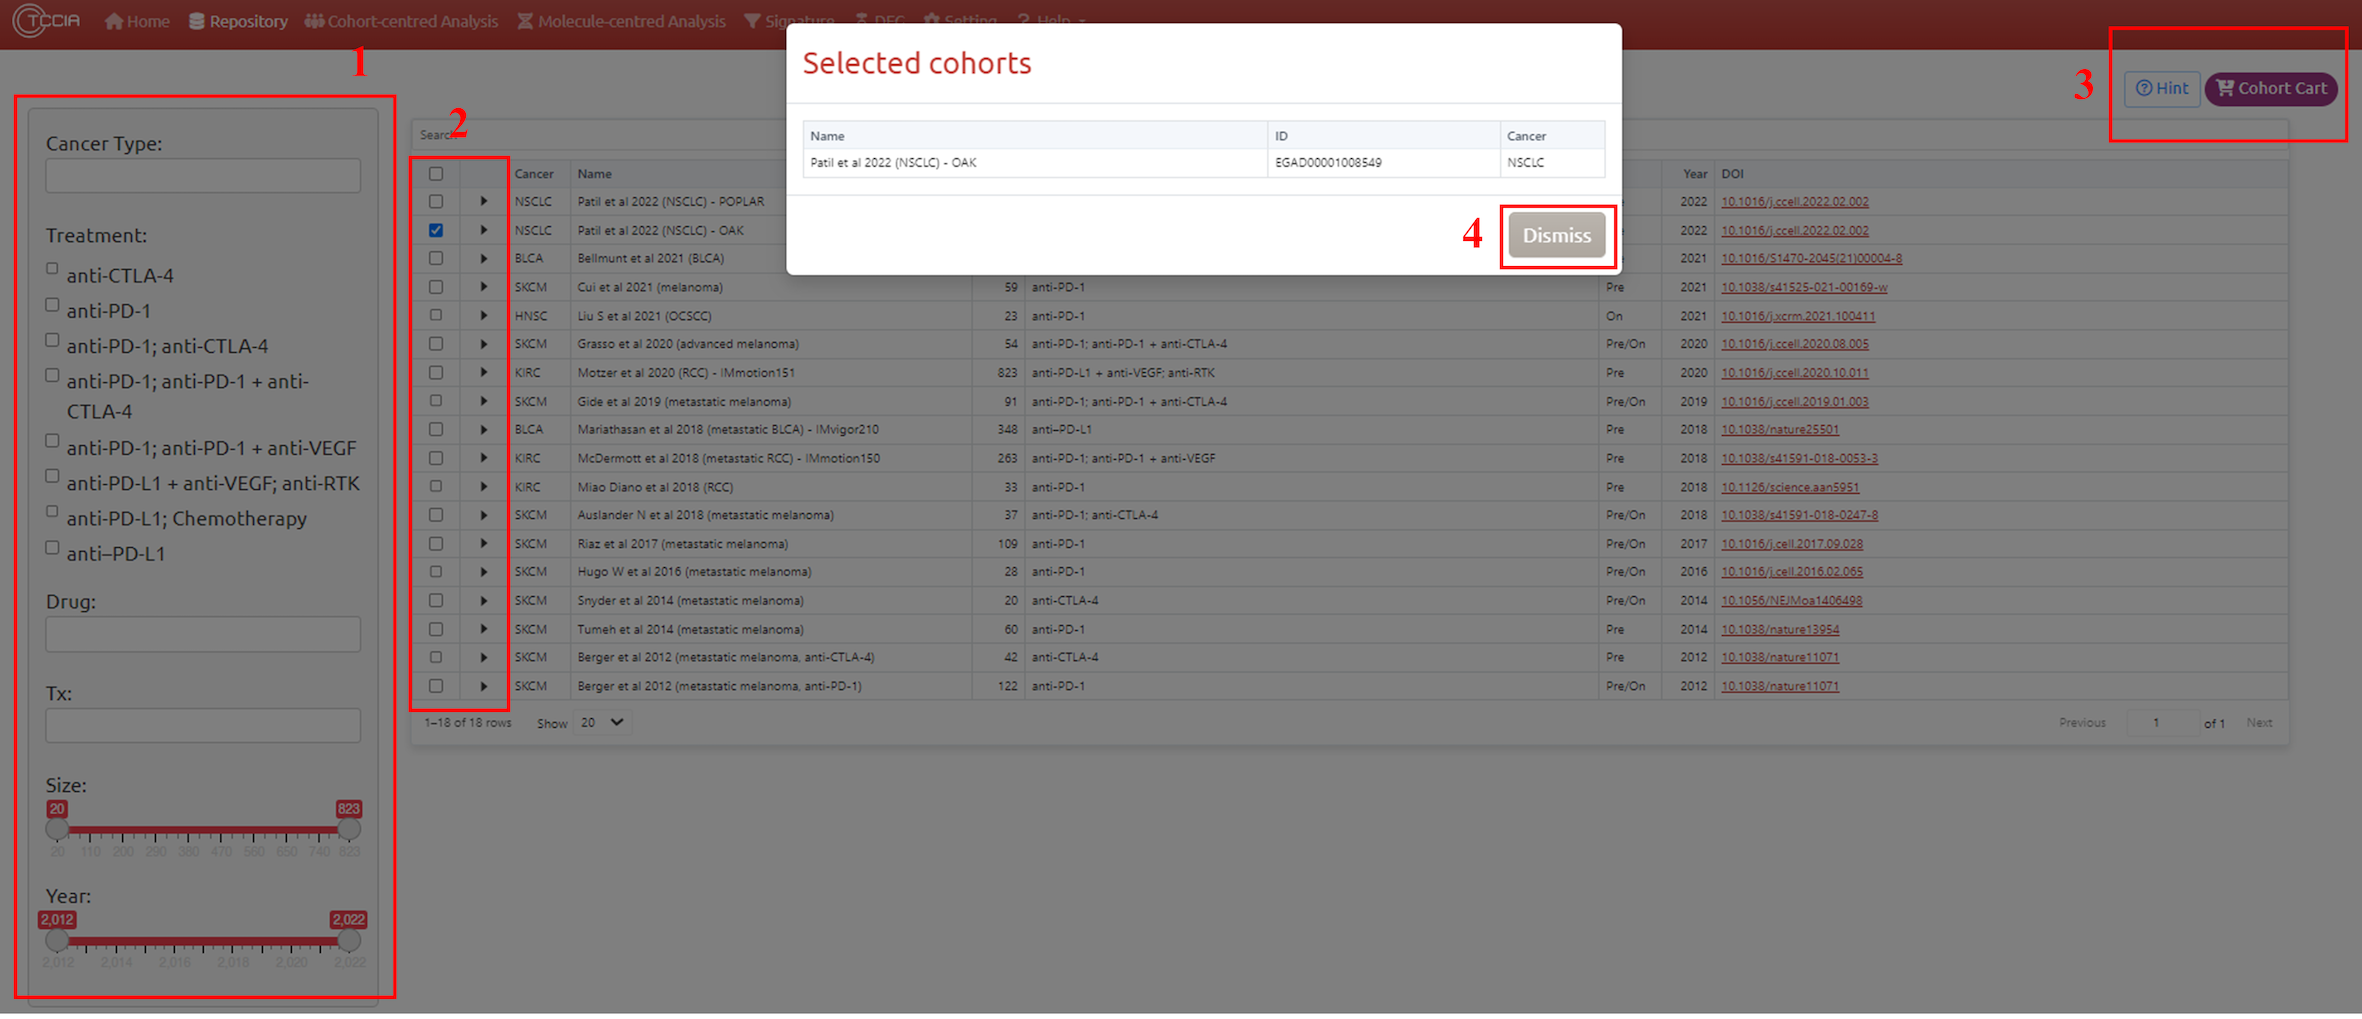
1. Cohort filter (optional)
You can quickly filter the datasets by filters on the left panels. The filters include: Cancer Type, Treatment Type, Drug, Treatment information (Pre/on treatment), Cohort Size, Publish year.
2. Cohort selection
The filtered cohort table are not selected, you have to use your mouse to click one or more data rows to select corresponding datasets.
3. Add into Cart (optional)
You can click the ‘Cart’ button to confirm selected cohorts and go to the analysis modules on the other pages.
3. Cohort-centred Page
3.1 Overview
The functional modules presented on this page are designed to help users explore CircRNAs in a single immunotherapy cohort. All selectable datasets are obtained from cohorts that you choose on the ‘Repository’ page. When selecting different datasets in some of the modules on this page, make sure that they are from the same cohort; otherwise, a box will typically pop up reminding you about this.
Note: Reading the papers the cohorts derived from is highly recommended. Some cohorts may have complex designs, which means that the phenotype data could include samples taken both before and after therapy (stored in the ‘Response2’ column) or samples with different treatments. By default, only immunotherapy-related samples are included. However, you can check the ‘Setting’ page for control. When using the data, please ensure that it meets your requirements and filter the data if necessary using the options available on the right panel.
Five analysis modules are provided for solving common analysis tasks:
3.2 Scatter-Correlation
To analyze and visualize correlation for two variables. How to filter cohort please see the filter tutorial.
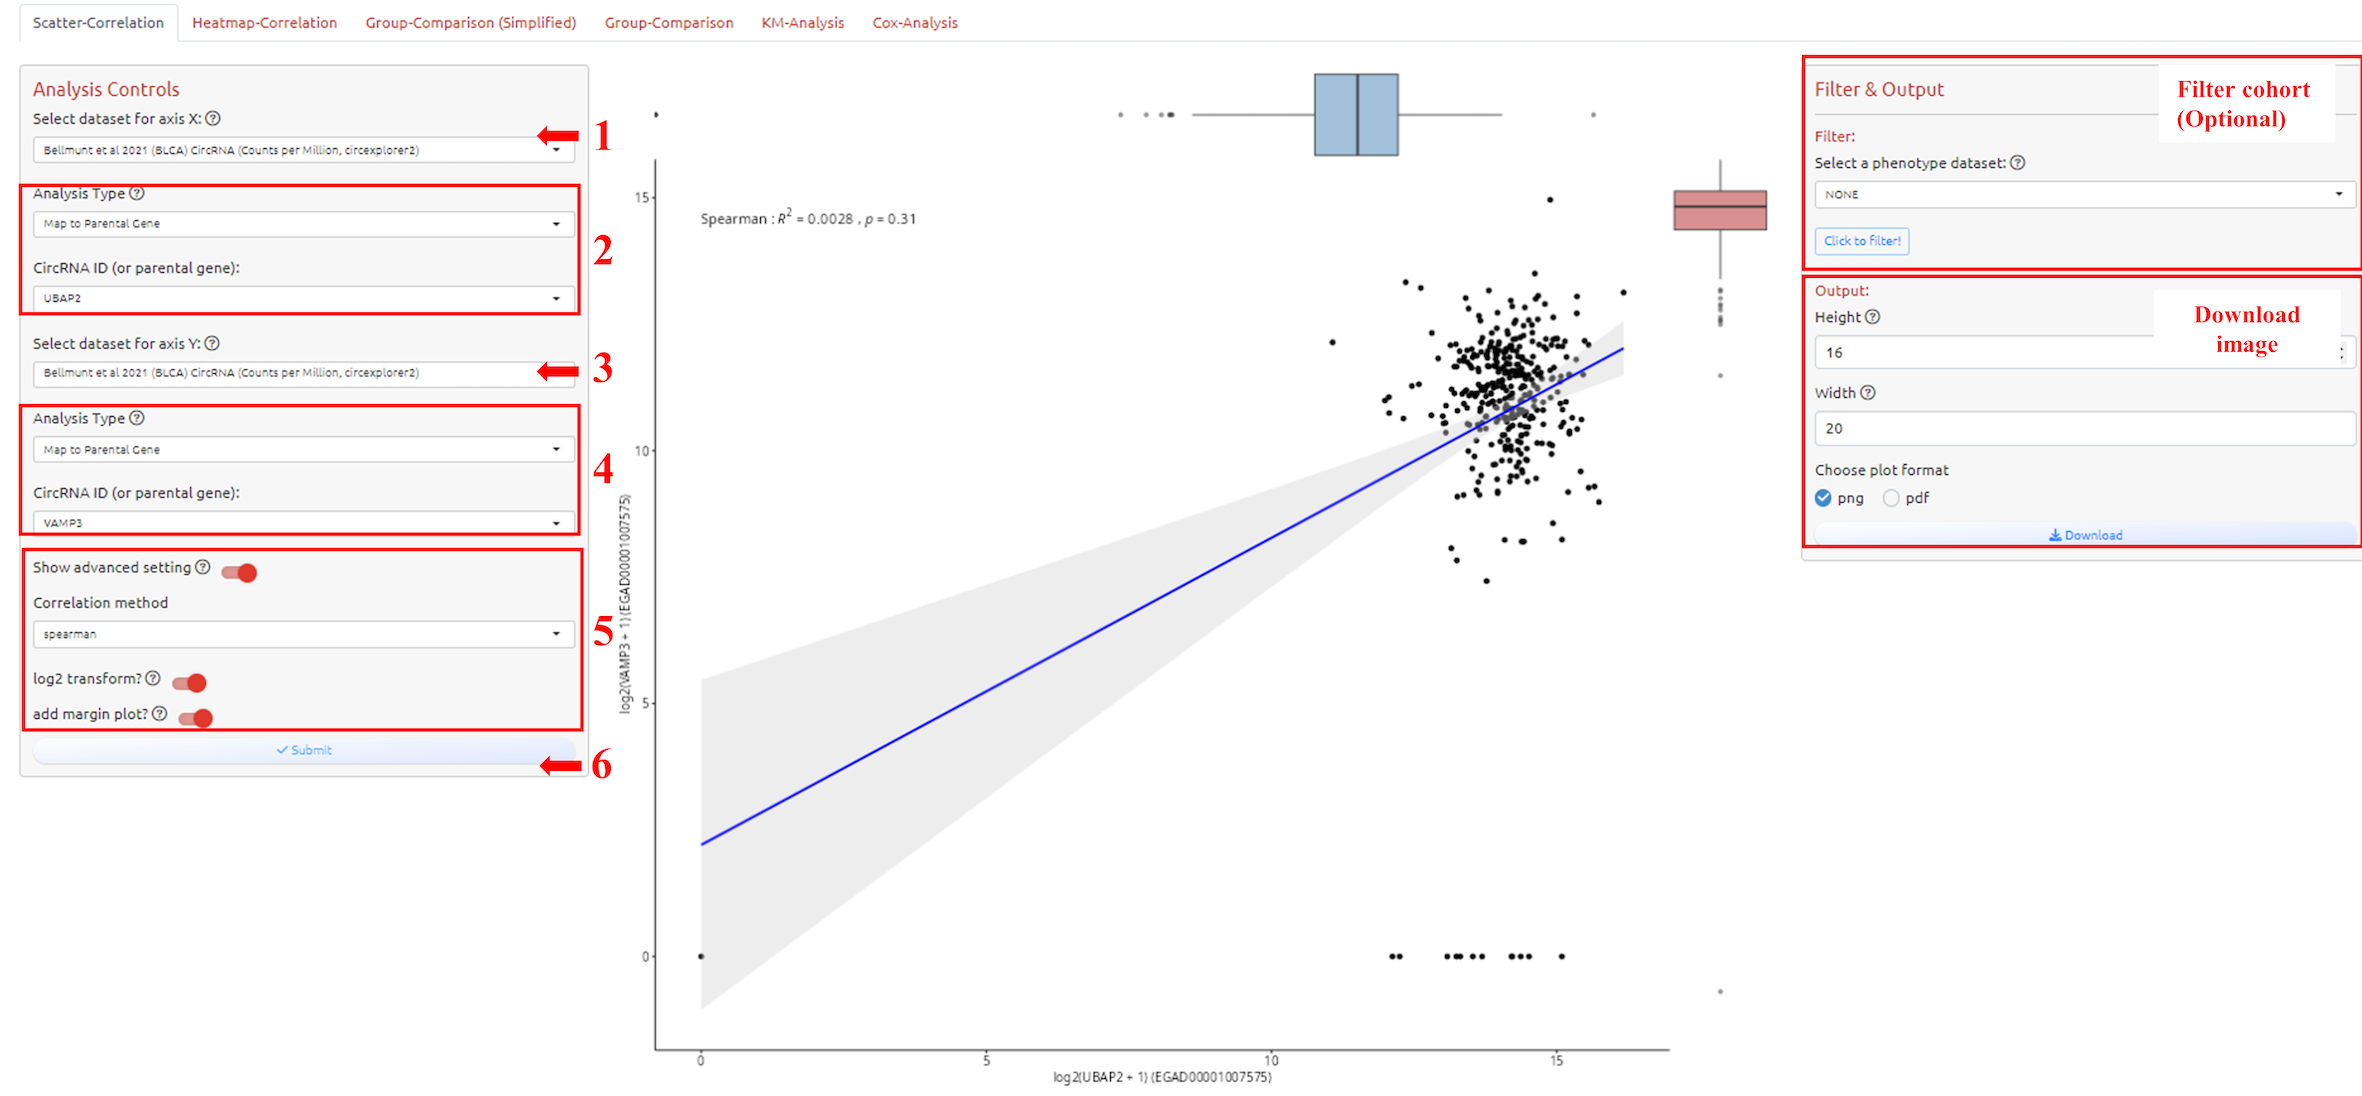
1. Select dataset for axis X
2. Select circRNA-ID or Host Gene of the circRNA-ID
3. Select dataset for axis Y (Make sure select the same dataset in step 1)
4. Select circRNA-ID or Host Gene of the circRNA-ID
5. Adjust parameters for analysis
6. Submit the analysis
3.3 Heatmap-Correlation
To analyze and visualize correlation for two or more variables. How to filter cohort please see the filter tutorial.
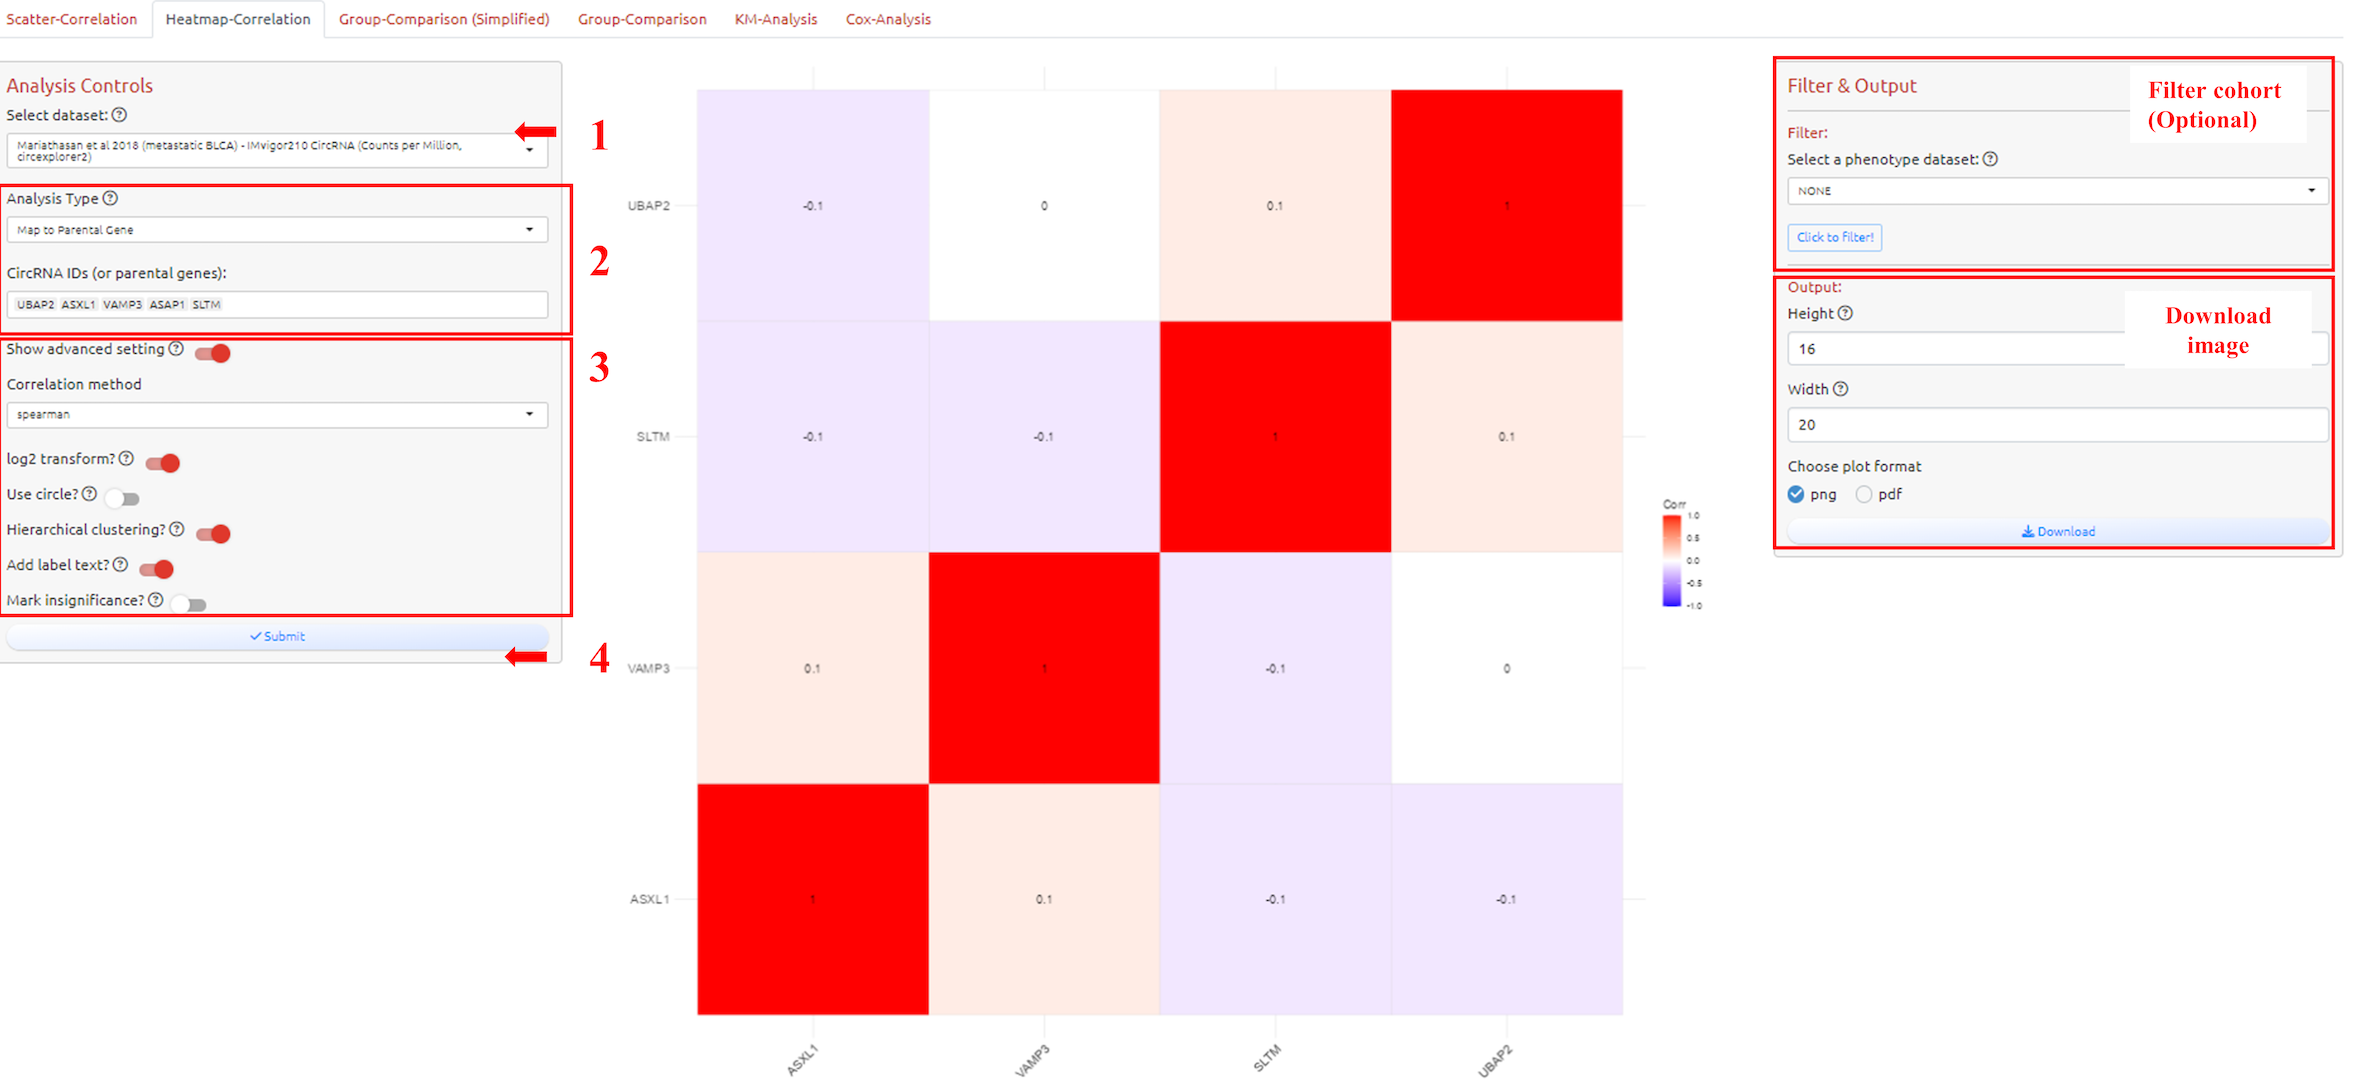
1. Select dataset
2. Select circRNA-ID(s) or Host Gene(s) of the circRNA-ID(s)
3. Adjust parameters for analysis
4. Submit the analysis
3.4 Group-Comparison (Simplified)
To analyze and visualize numeric difference of a continuous variable between multiple groups of a variable. How to filter cohort please see the filter tutorial.
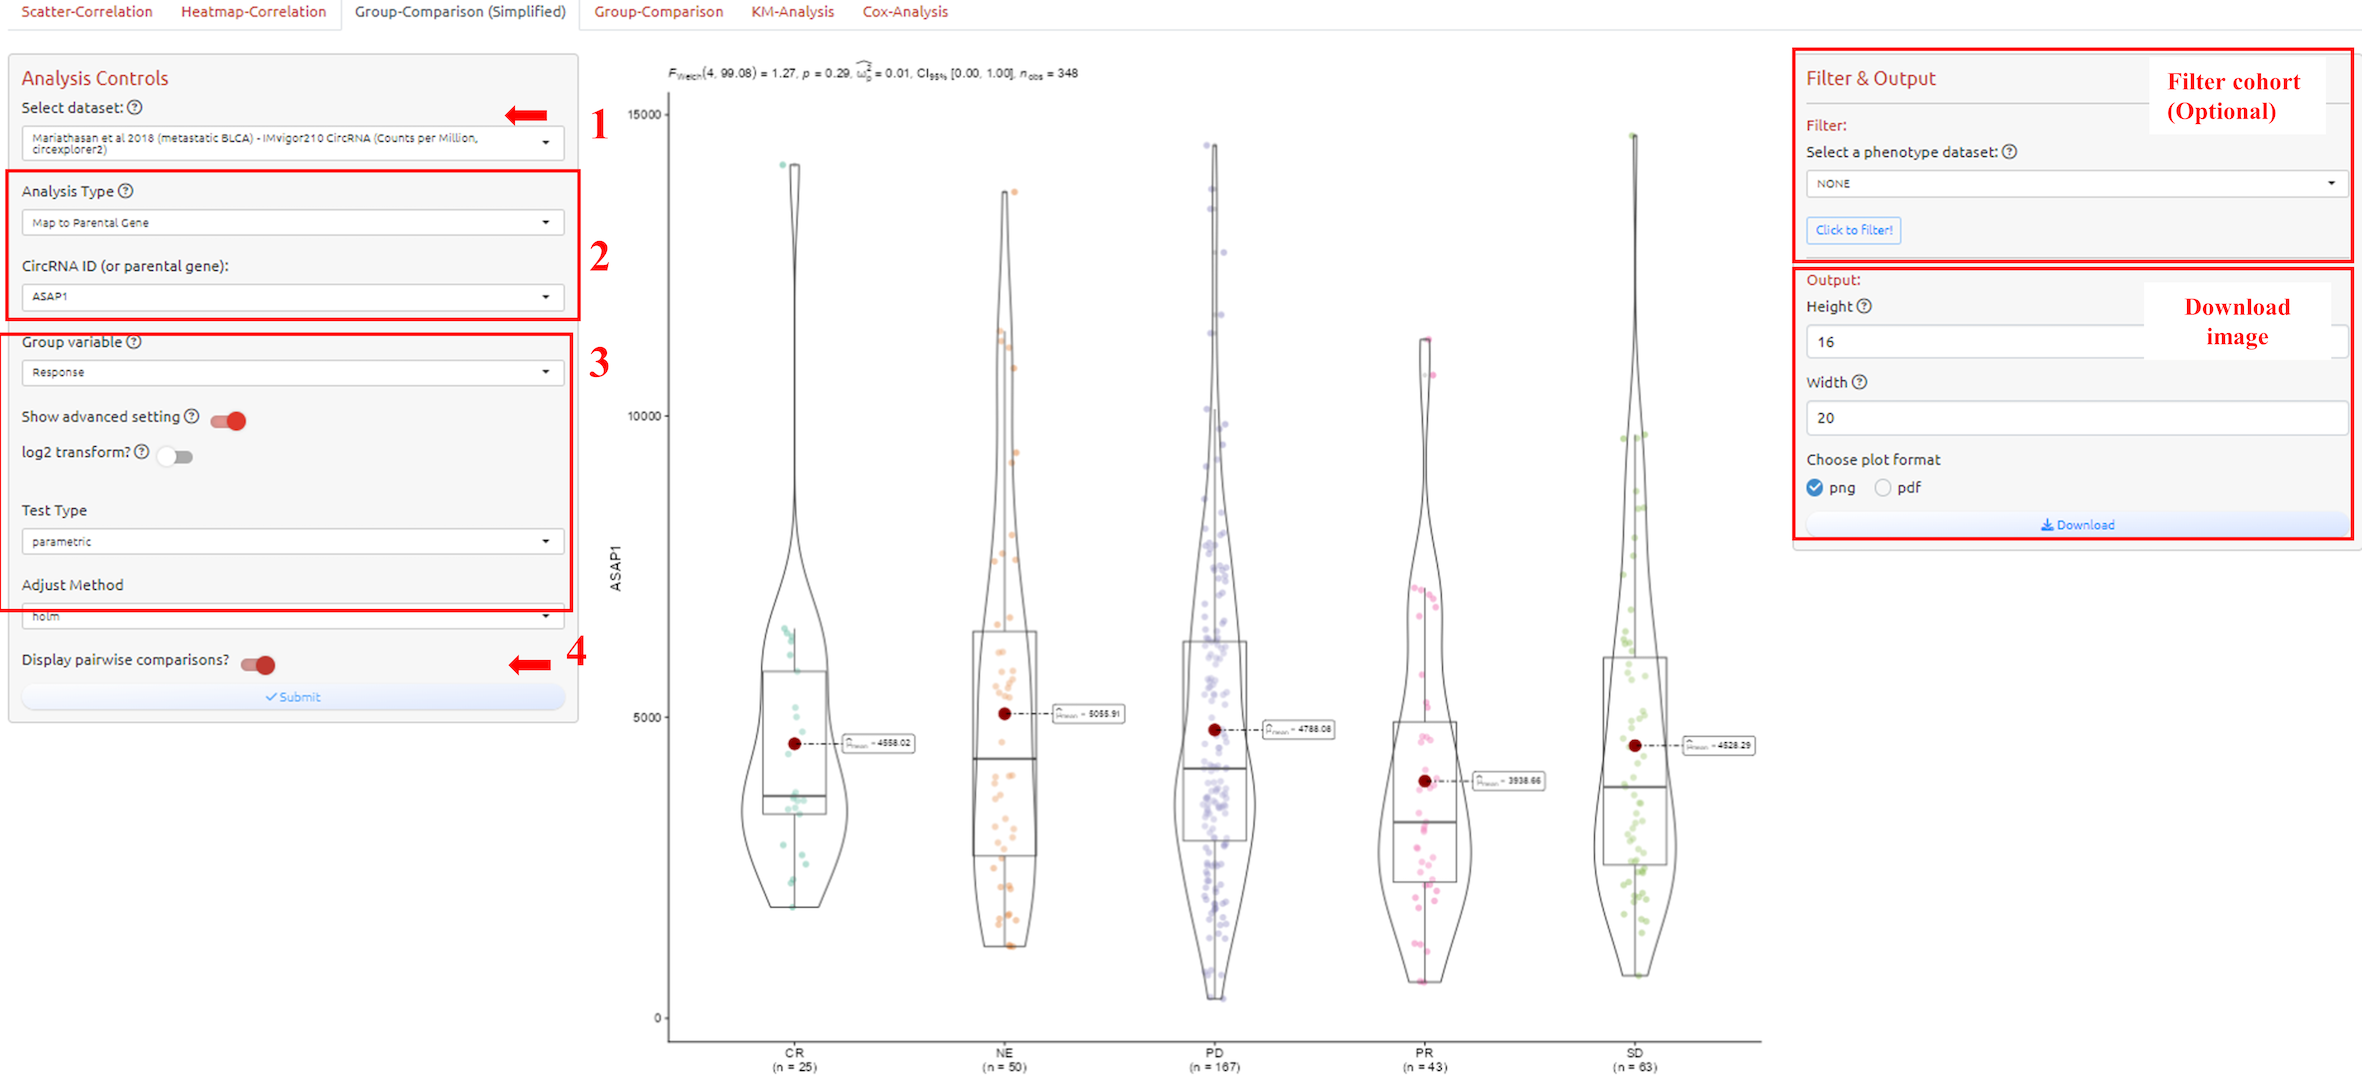
1. Select dataset
2. Select circRNA-ID or Host Gene of the circRNA-ID
3. Adjust parameters for analysis
4. Submit the analysis
3.5 Group-Comparison
To analyze and visualize numeric difference of a continuous variable between multiple groups of a variable in a more comprehensive manner. How to filter cohort please see the filter tutorial.
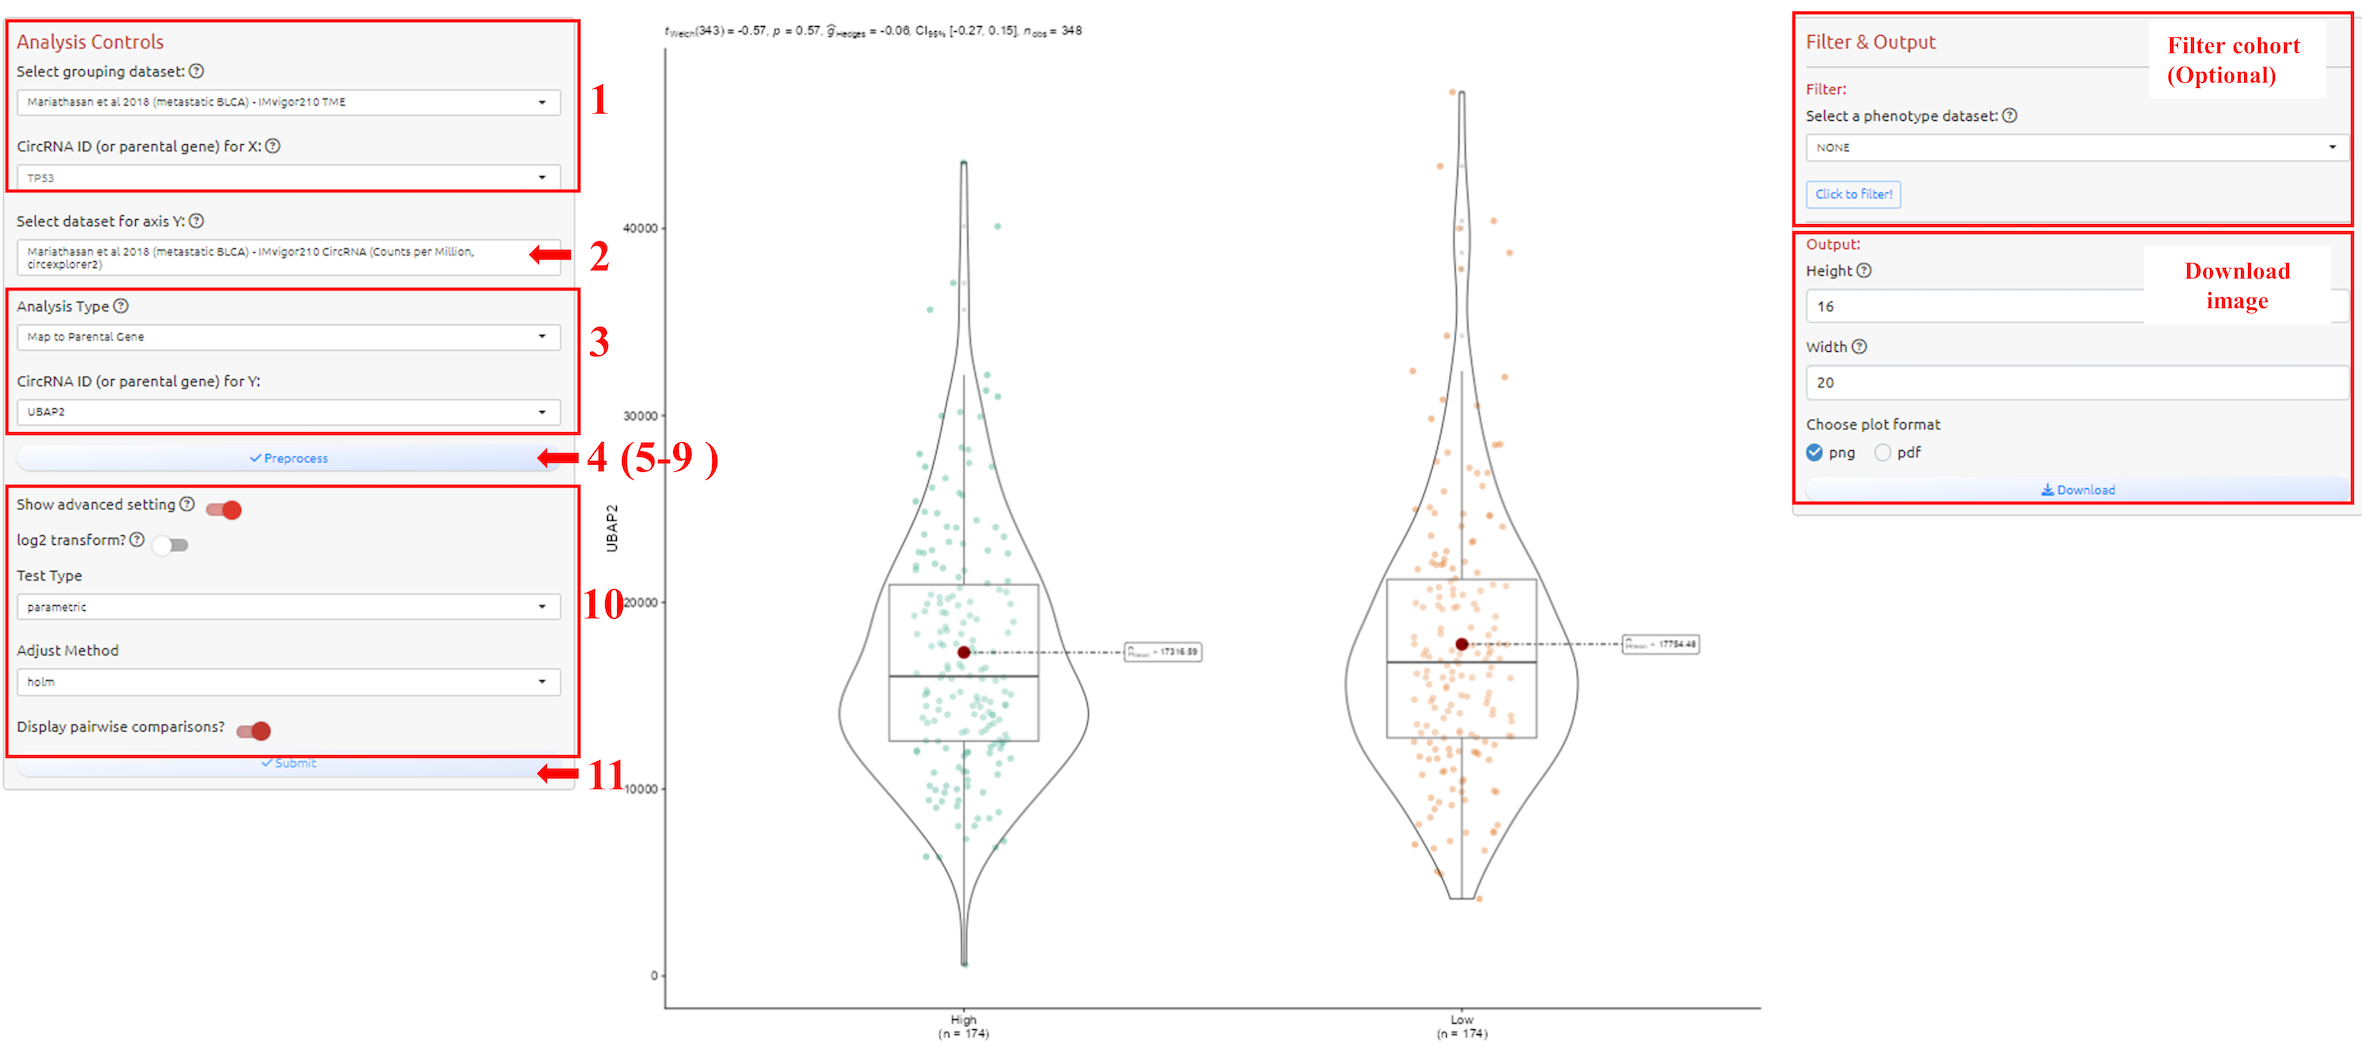
1. Select grouping dataset
2. Select dataset for axis Y
3. Select circRNA-ID or Host Gene of the circRNA-ID
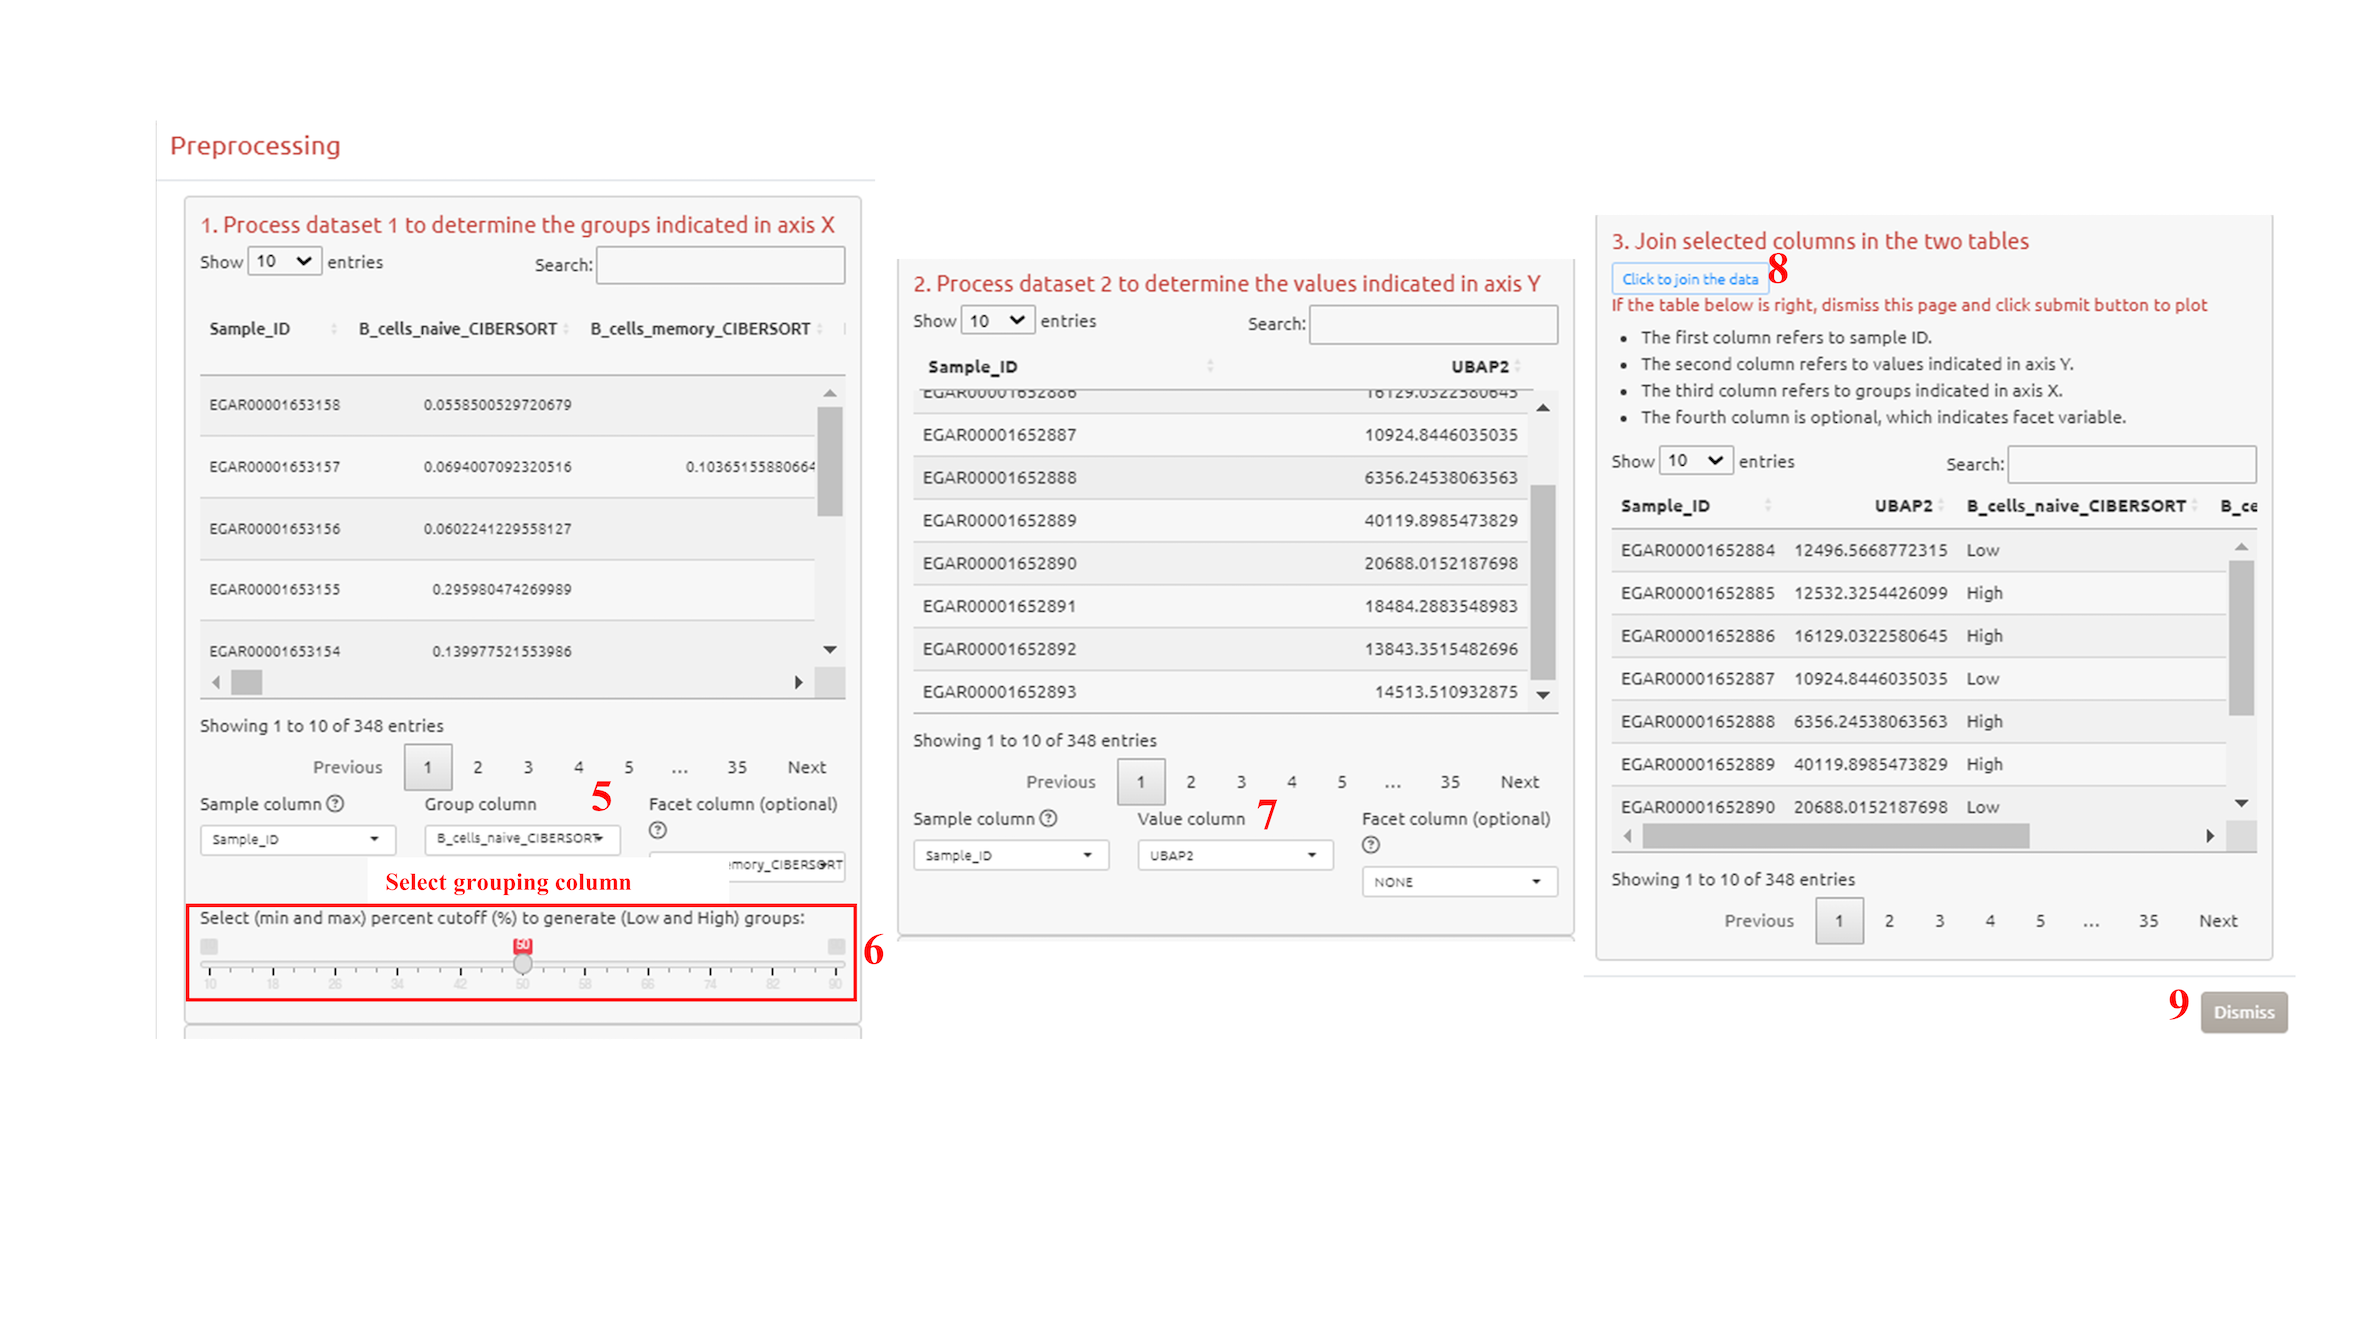
4. Preprocess the grouping dataset
5. Select grouping column
6. Choose the categories (for categorical variables) or the threshold (for numeric variables, e.g., TMB, expression of a CircRNA) for grouping
7. Select the values to show in axis Y
8. Click to join the data
9. Confirm the process and exit
10. Adjust parameters for analysis
11. Submit the analysis
3.6 KM-Analysis
To analyze and visualize survival curves between multiple groups of a variable. How to filter cohort please see the filter tutorial.
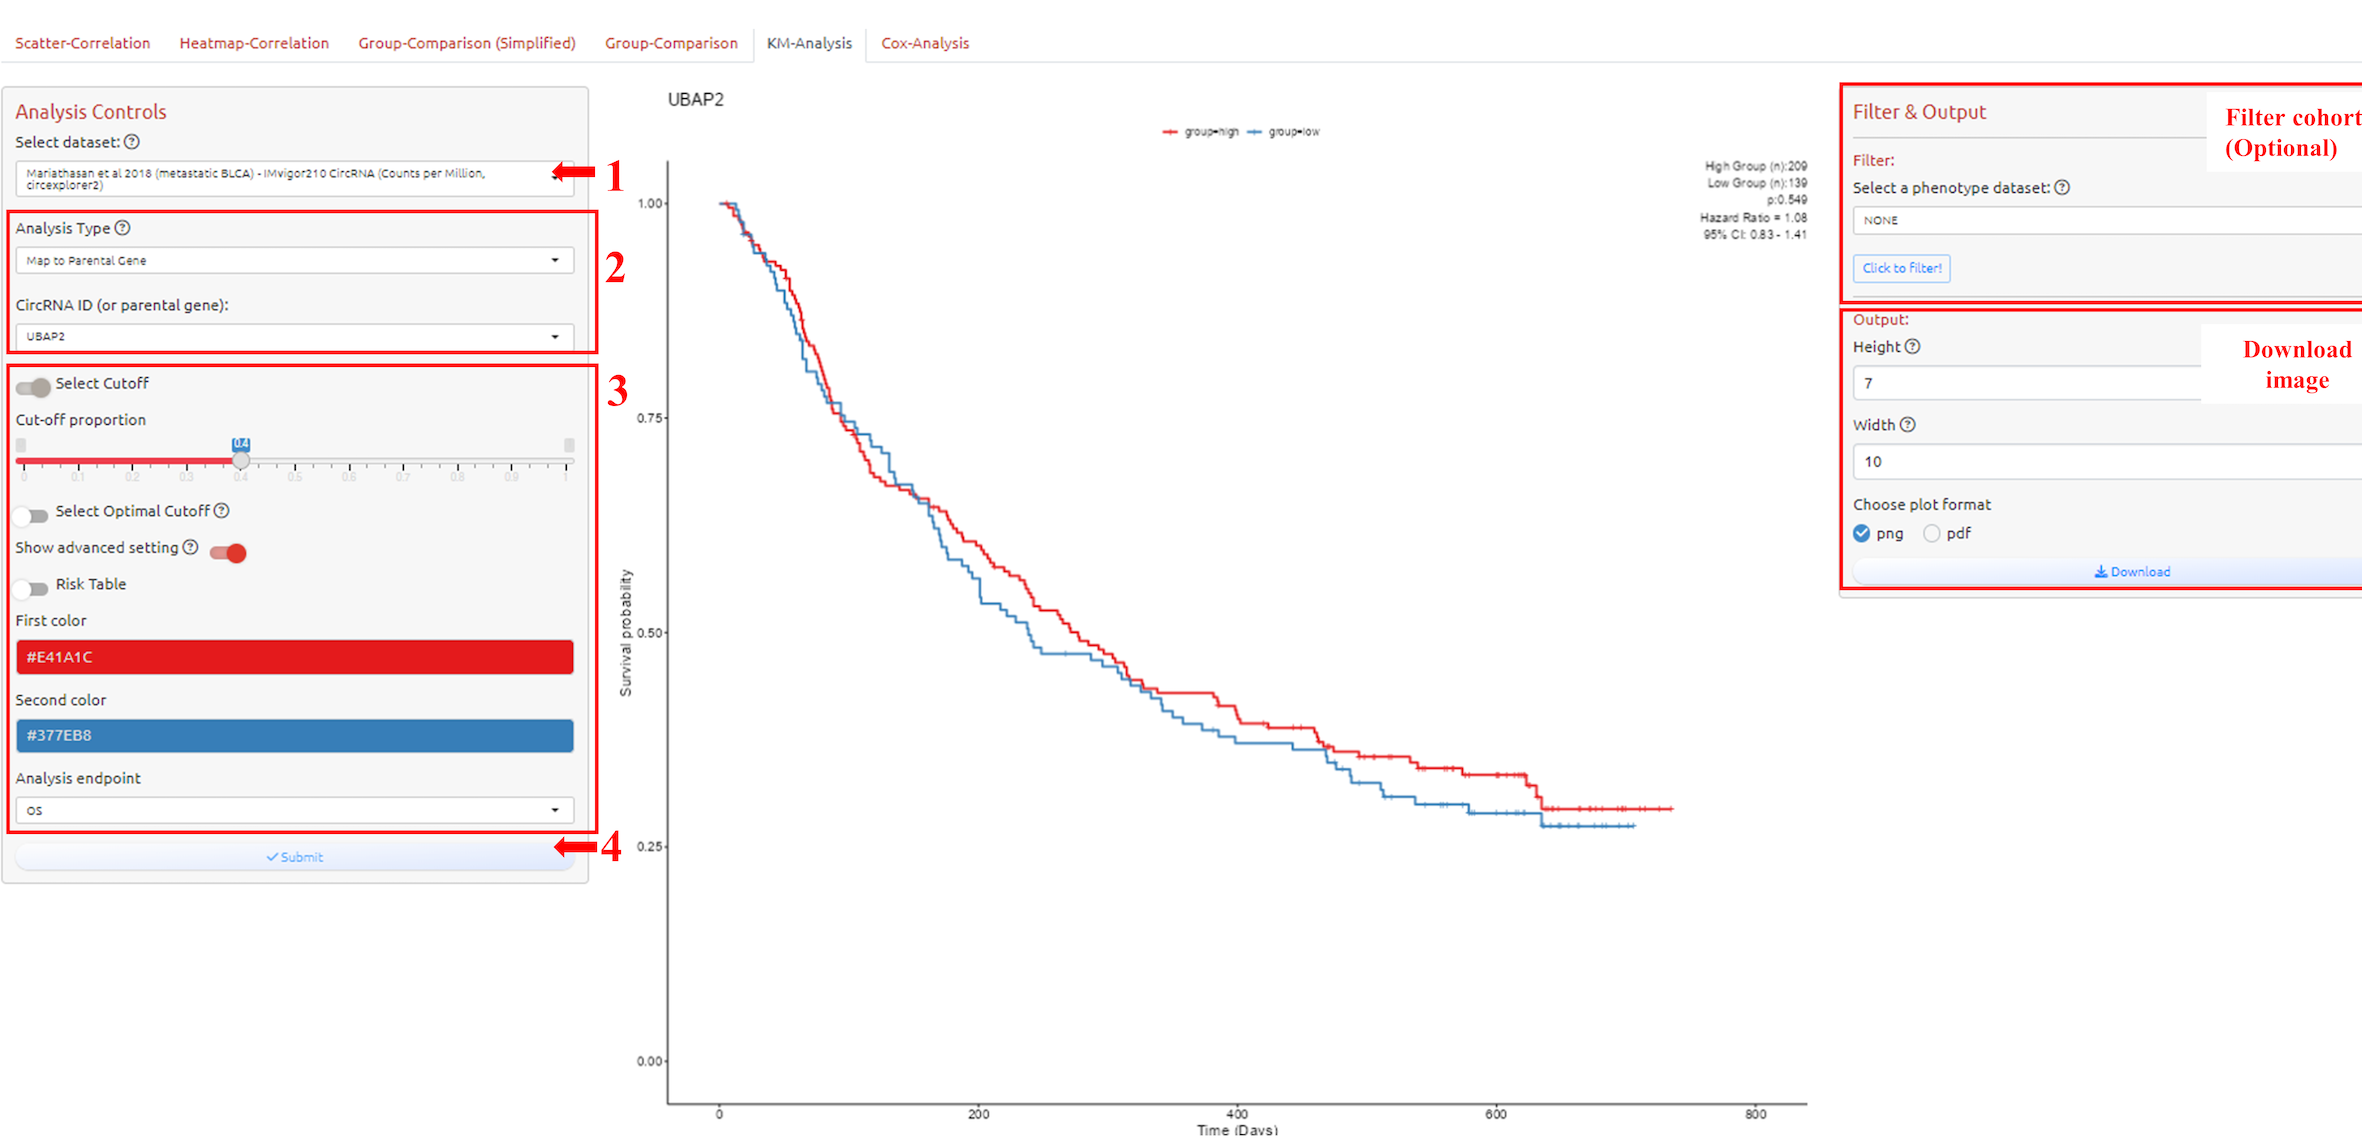
1. Select dataset
2. Select circRNA-ID or Host Gene of the circRNA-ID
3. Adjust parameters for analysis
4. Submit the analysis
3.7 Cox-Analysis
To do Cox-analysis between multiple groups of a variable. How to filter cohort please see the filter tutorial.
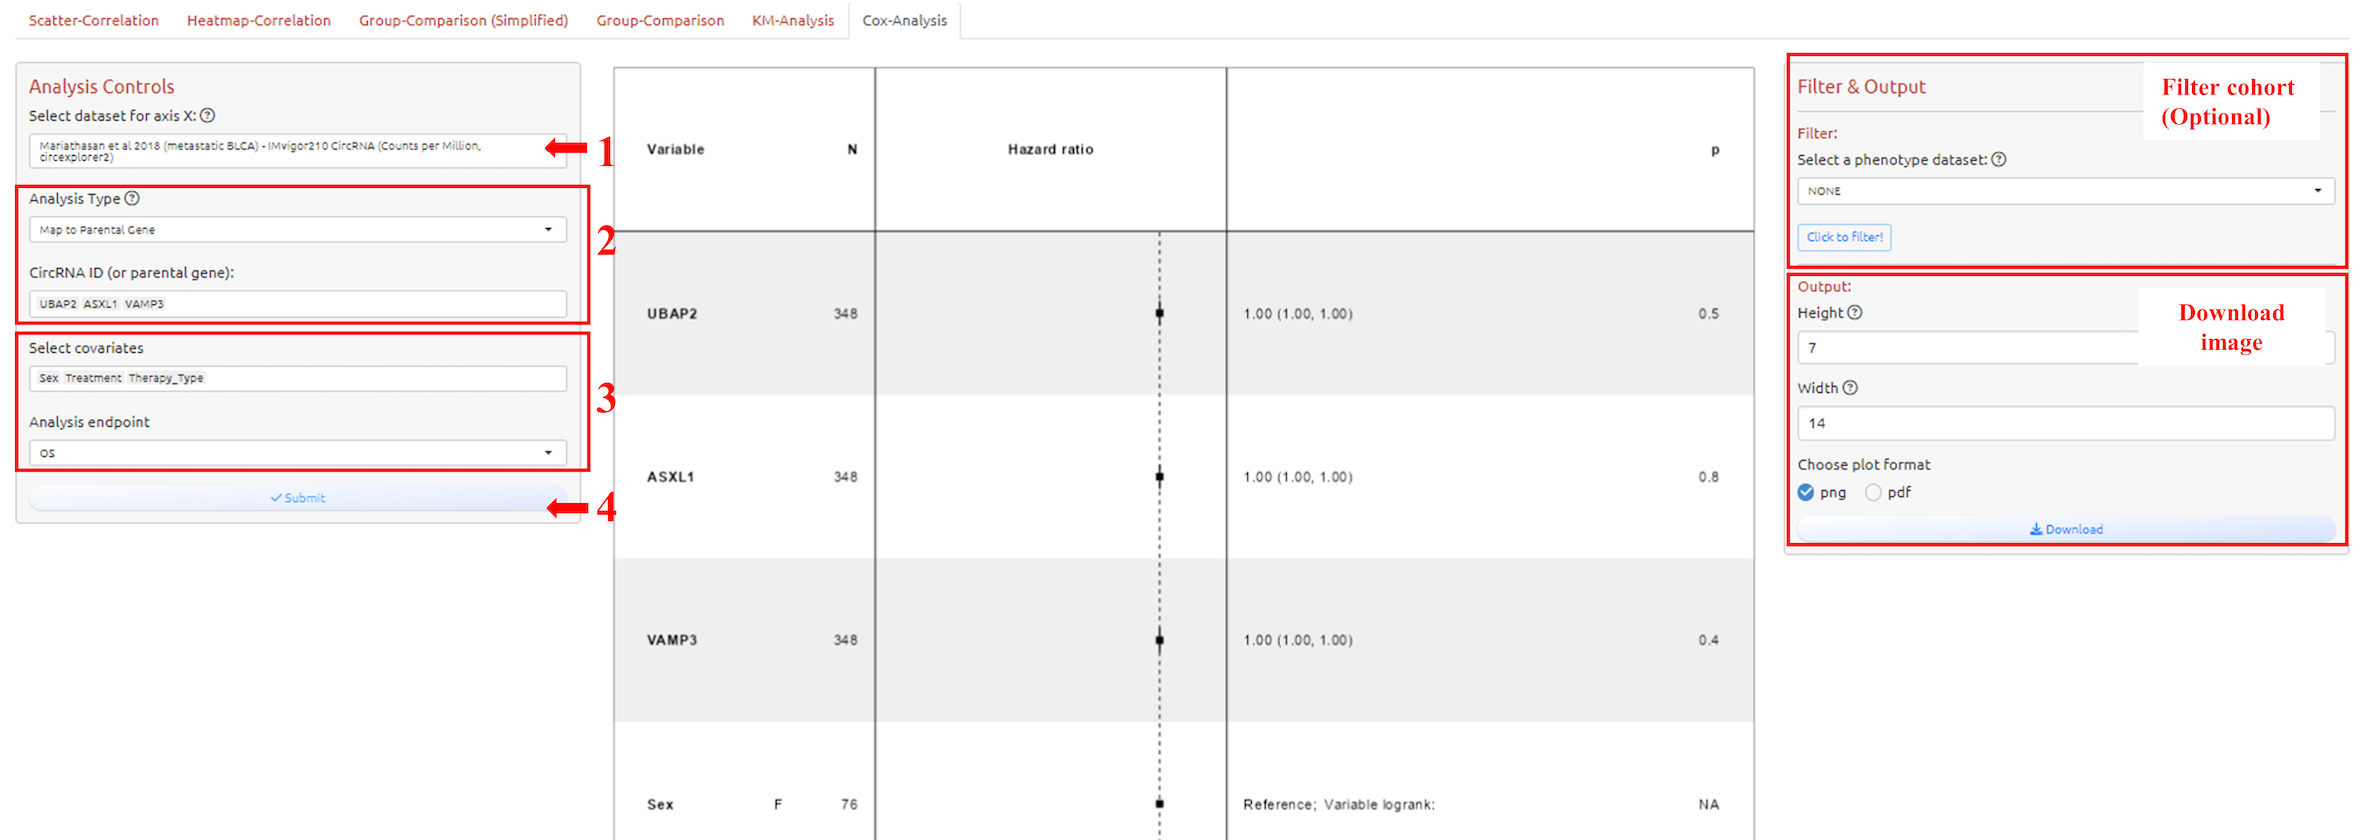
1. Select dataset
2. Select circRNA-ID or Host Gene of the circRNA-ID
3. Adjust parameters for analysis
4. Submit the analysis
3.8 Filter the cohort
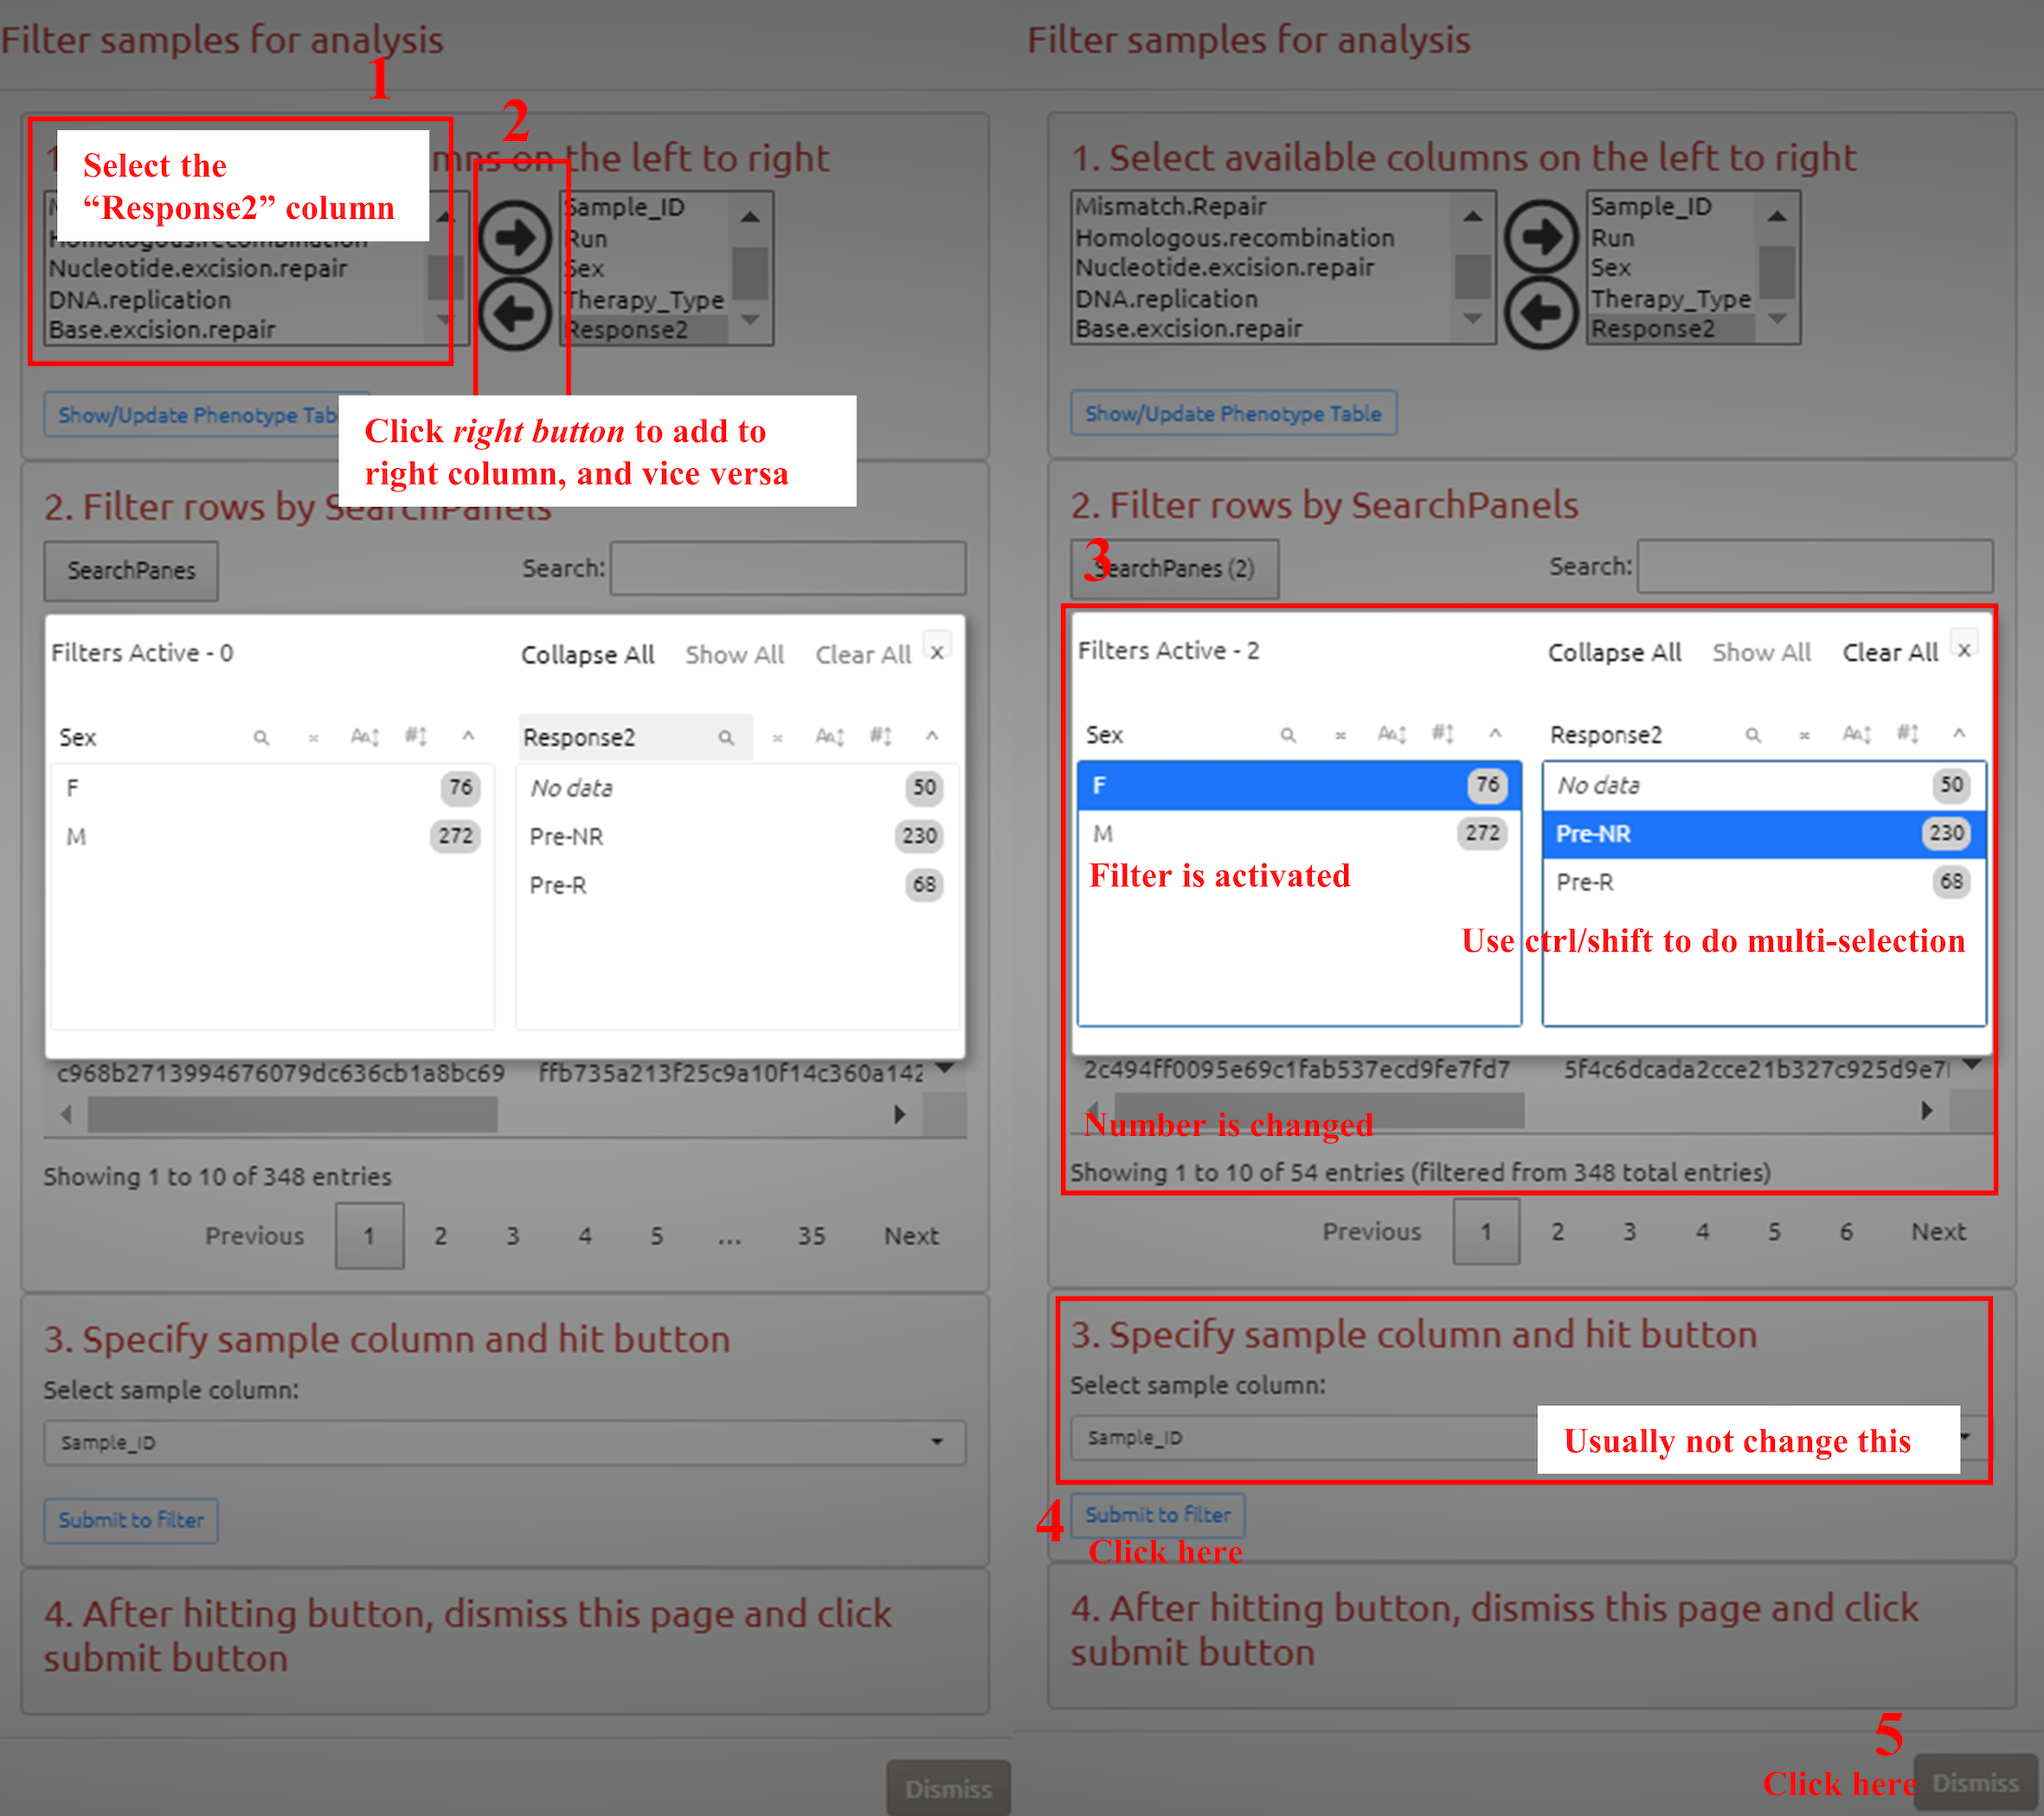
1. Select the variable in metadata
2. Add variable to the metadata for further filtering
3. Select the value to activate the filter in different variables
4. Submit to filter
5. Confirm filtering and go to the next analysis
4. Molecular-centred Page
4.1 Overview
The functional modules presented on this page are designed to help users explore CircRNAs across multiple immunotherapy cohorts. At default, only one cohort is selected. You may want to choose more cohorts on the ‘Repository’ page before exploring modules of this page. If you want to explore and analyze a specific cohort, please go to the ‘Cohort-centred Analysis’ page (although it may also work here). All selectable datasets are obtained from cohorts that you choose on the ‘Repository’ page.
4.2 Distribution of single circRNA
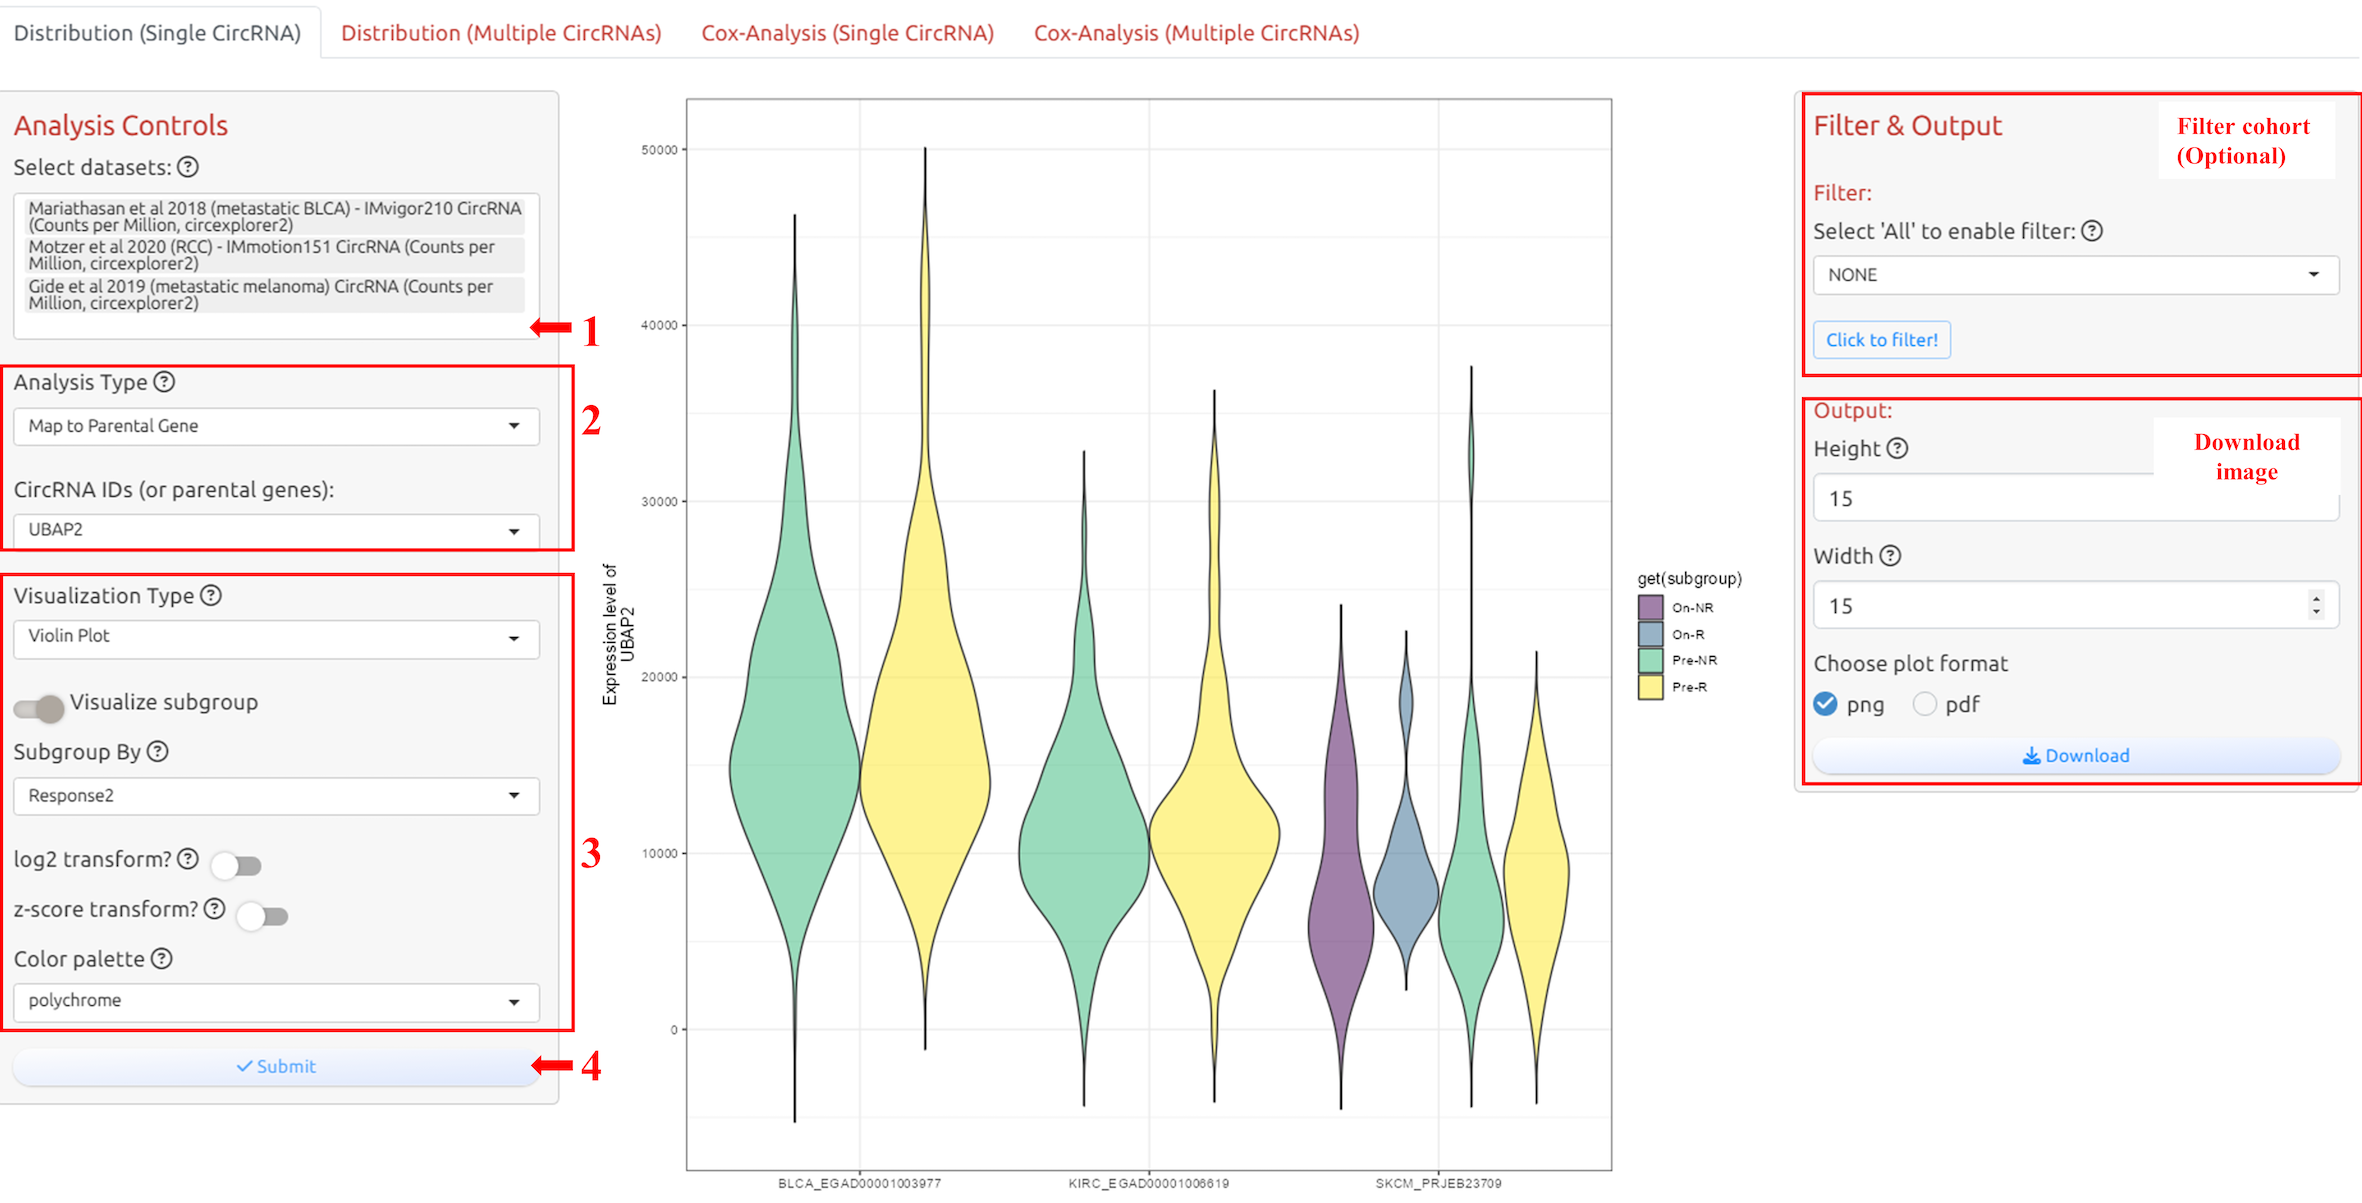
1. Select datasets
2. Select circRNA-ID or Host Gene of the circRNA-ID
3. Adjust parameters for analysis
4. Submit the analysis
4.3 Distribution of multi-circRNAs
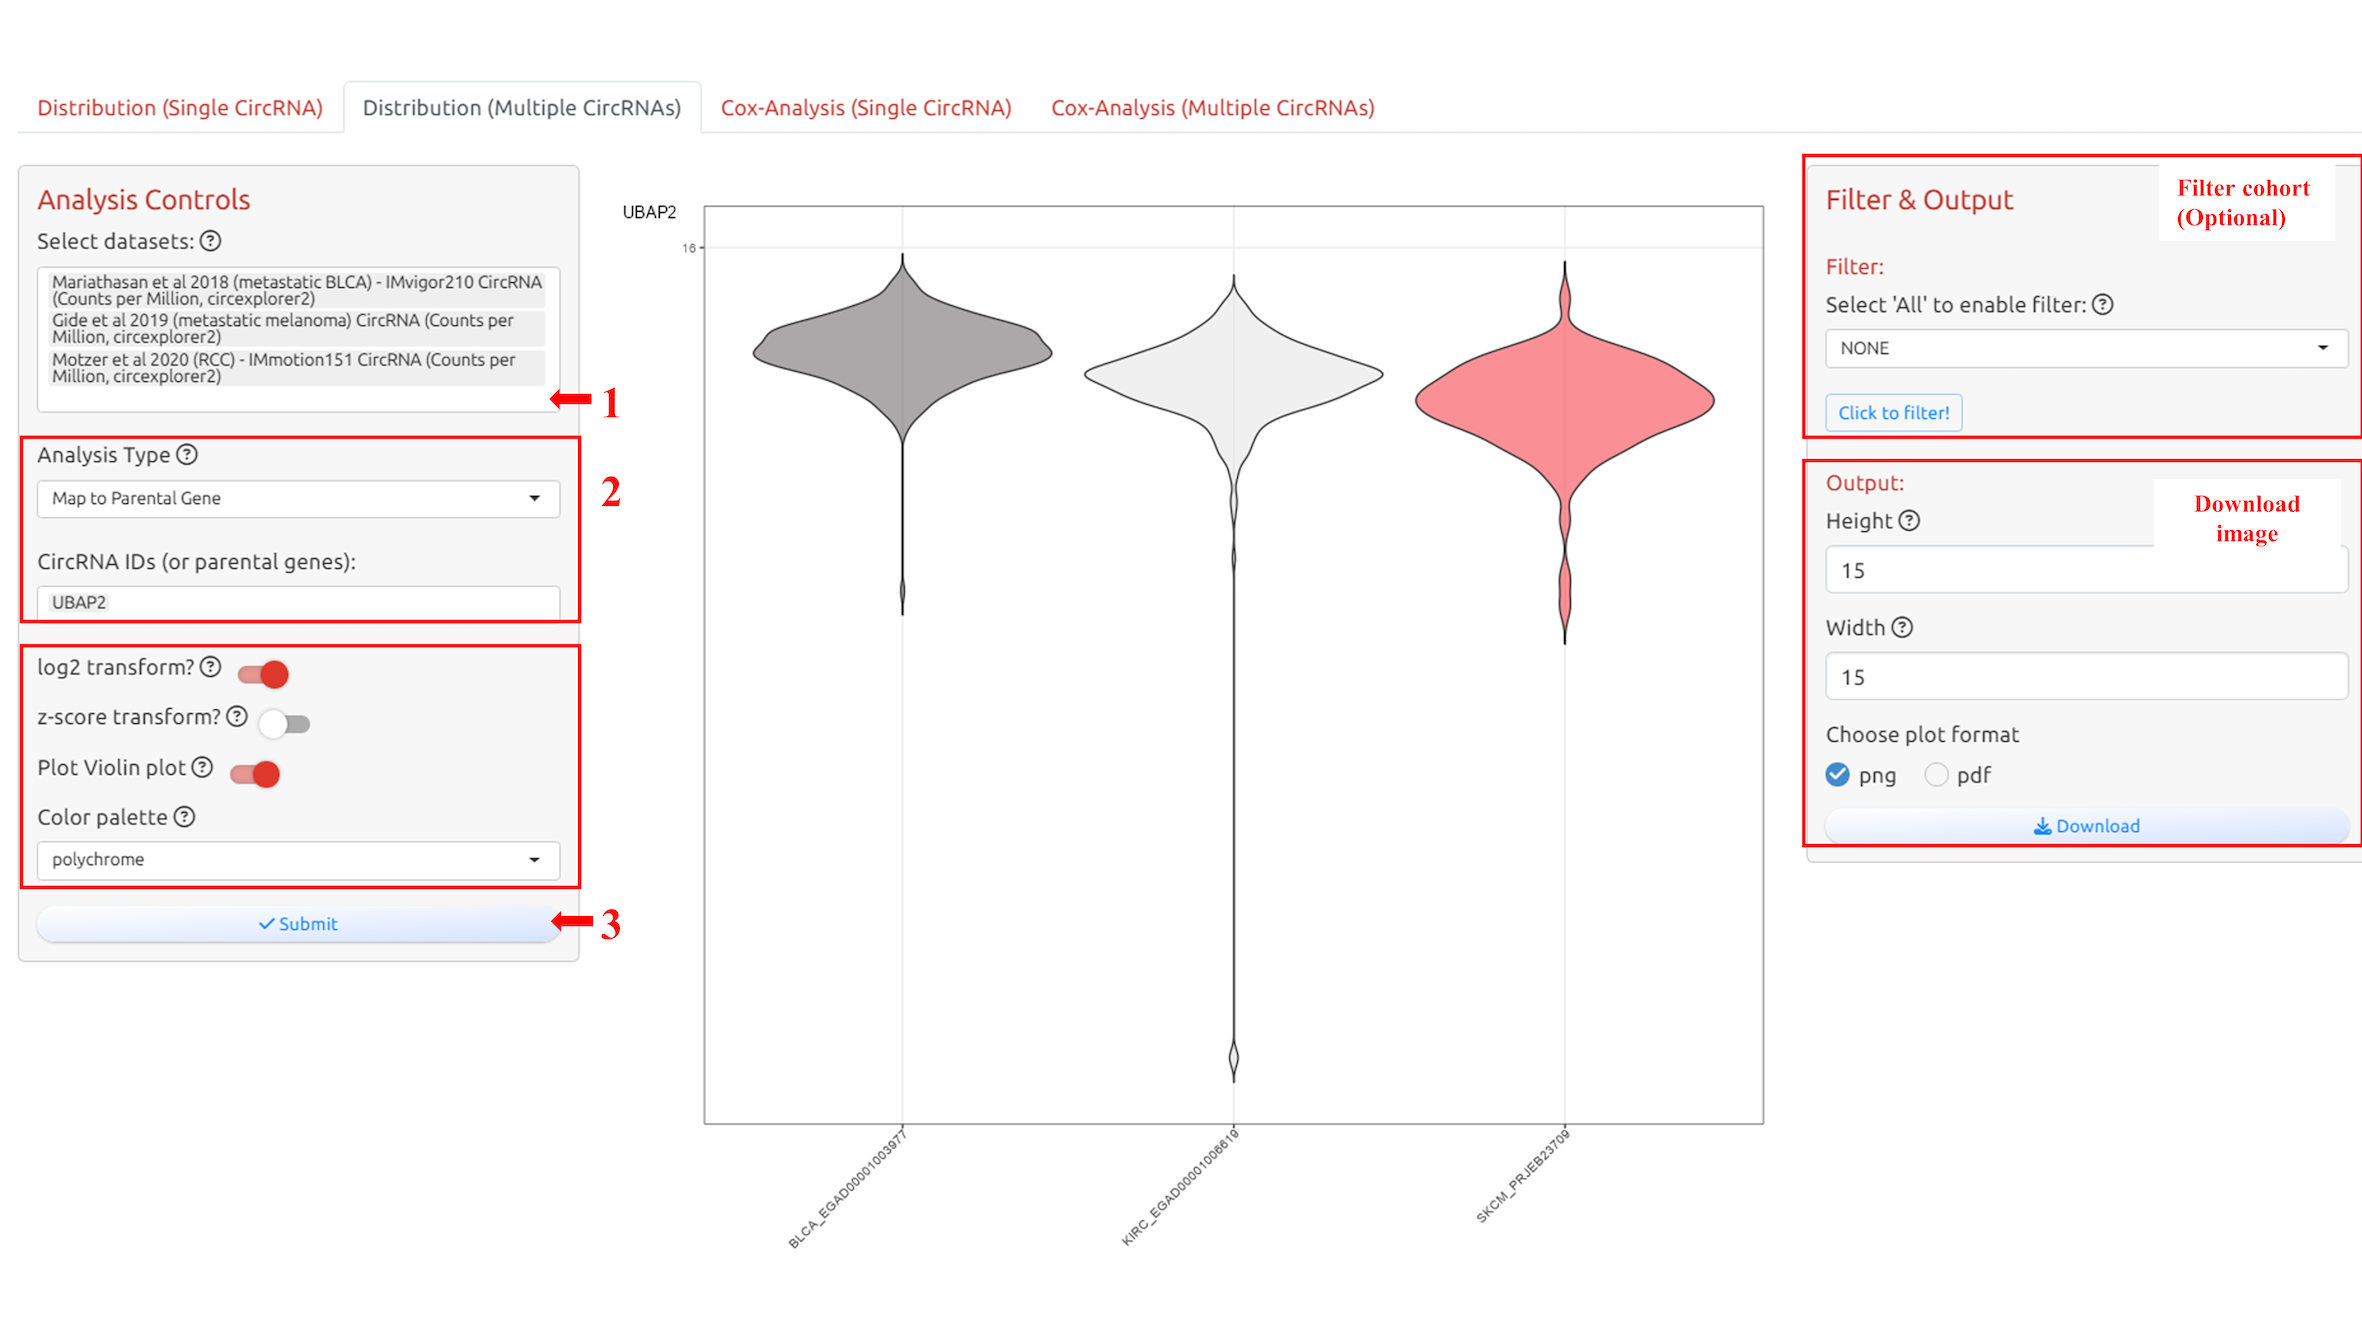
1. Select datasets
2. Select circRNA-ID(s) or Host Gene(s) of the circRNA-ID(s)
3. Adjust parameters for analysis
4. Submit the analysis
4.4 Cox analysis for single circRNA
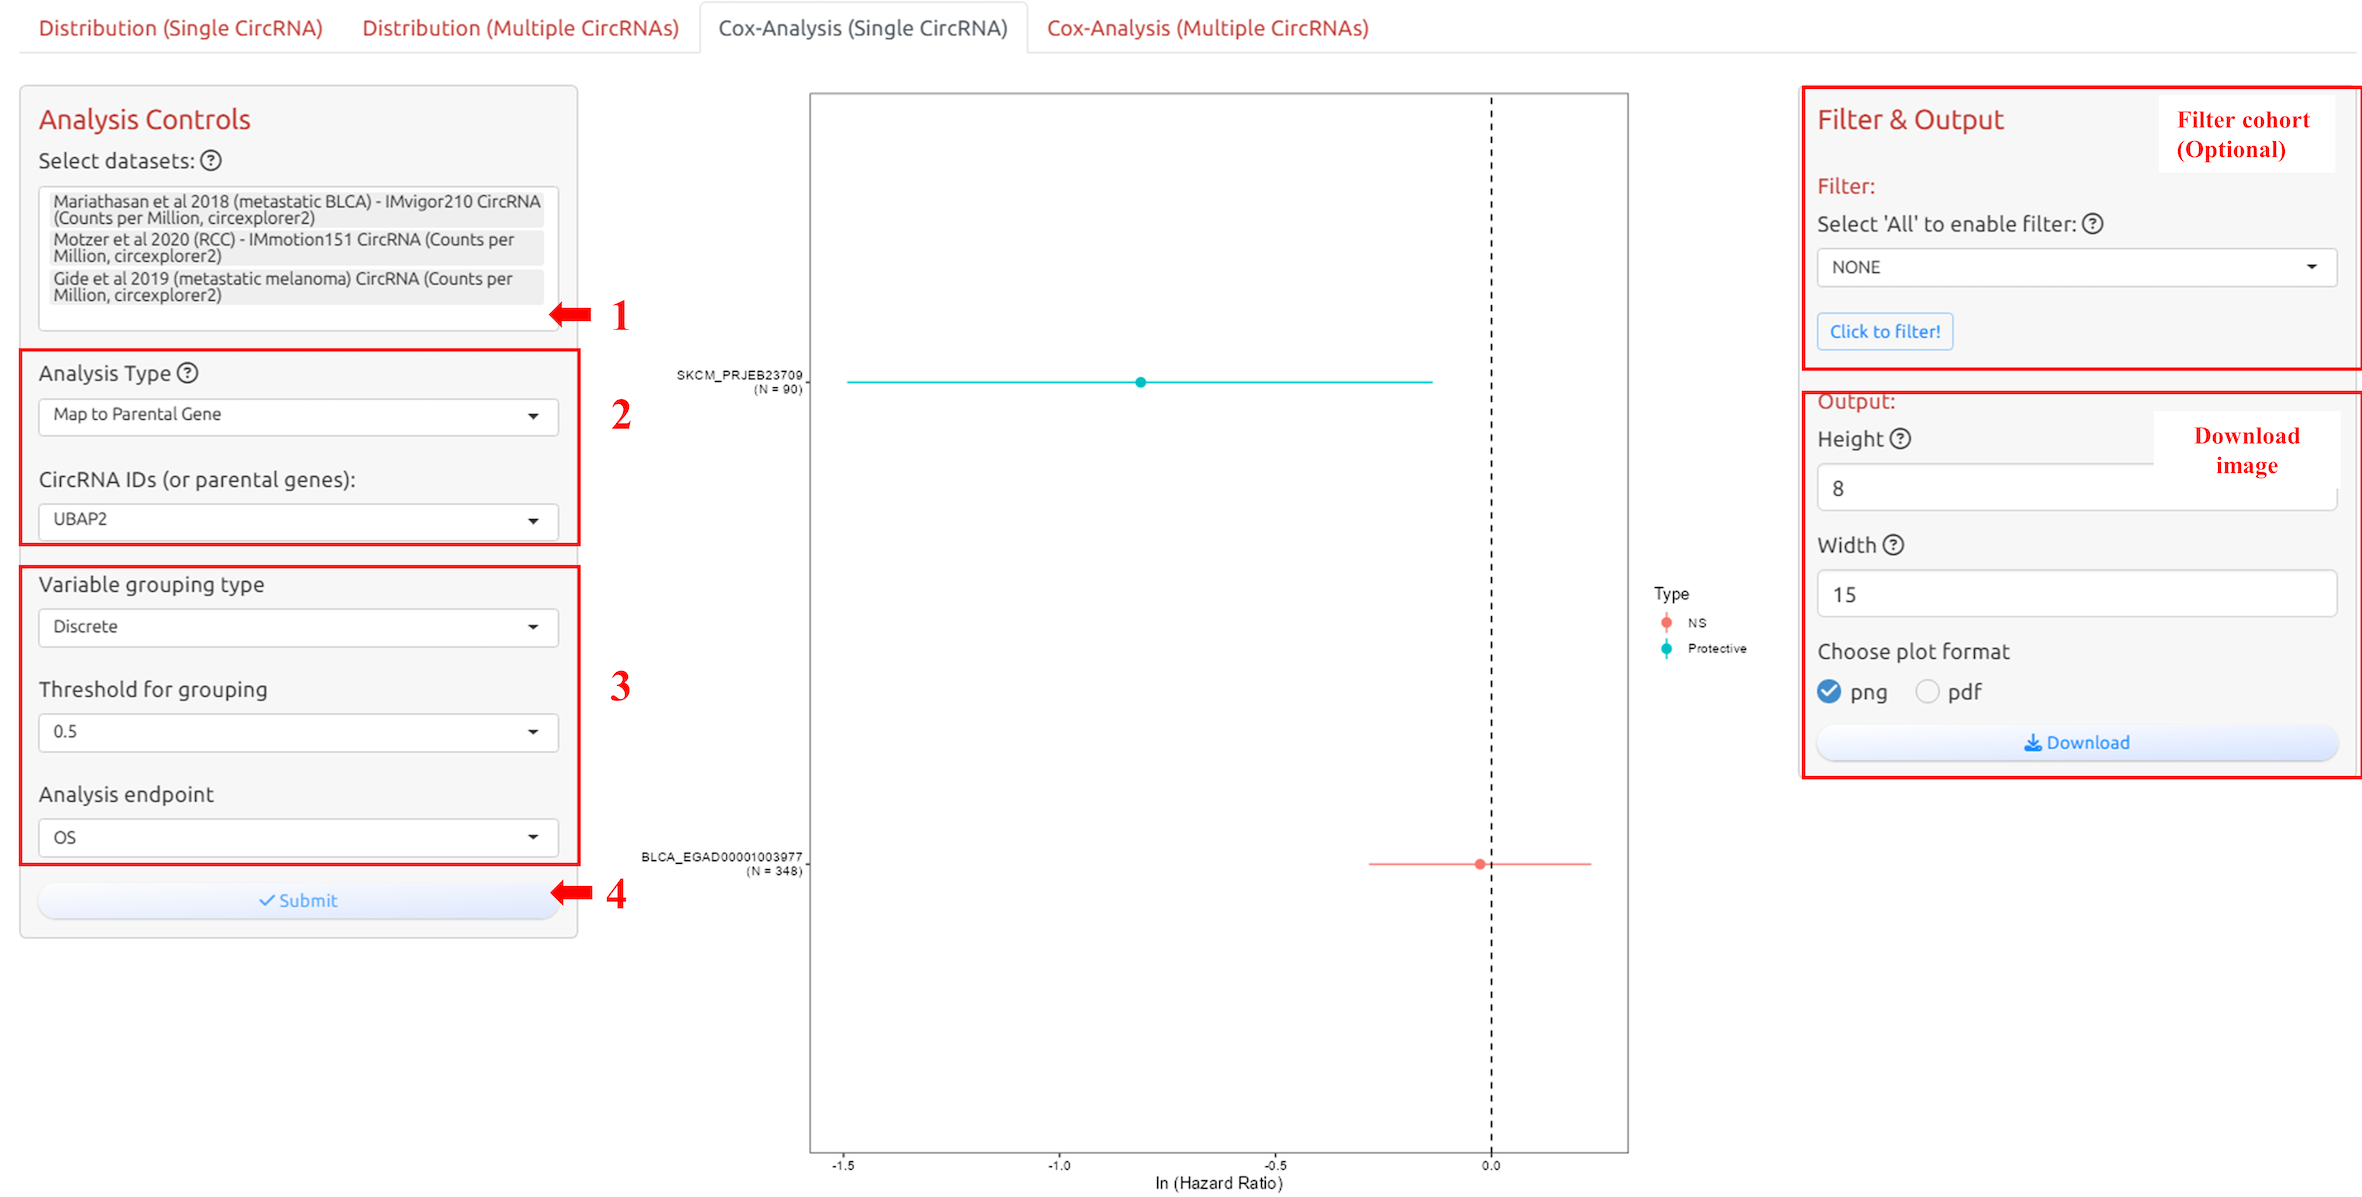
1. Select datasets
2. Select circRNA-ID or Host Gene of the circRNA-ID
3. Adjust parameters for analysis
4. Submit the analysis
4.5 Cox analysis for multiple circRNAs
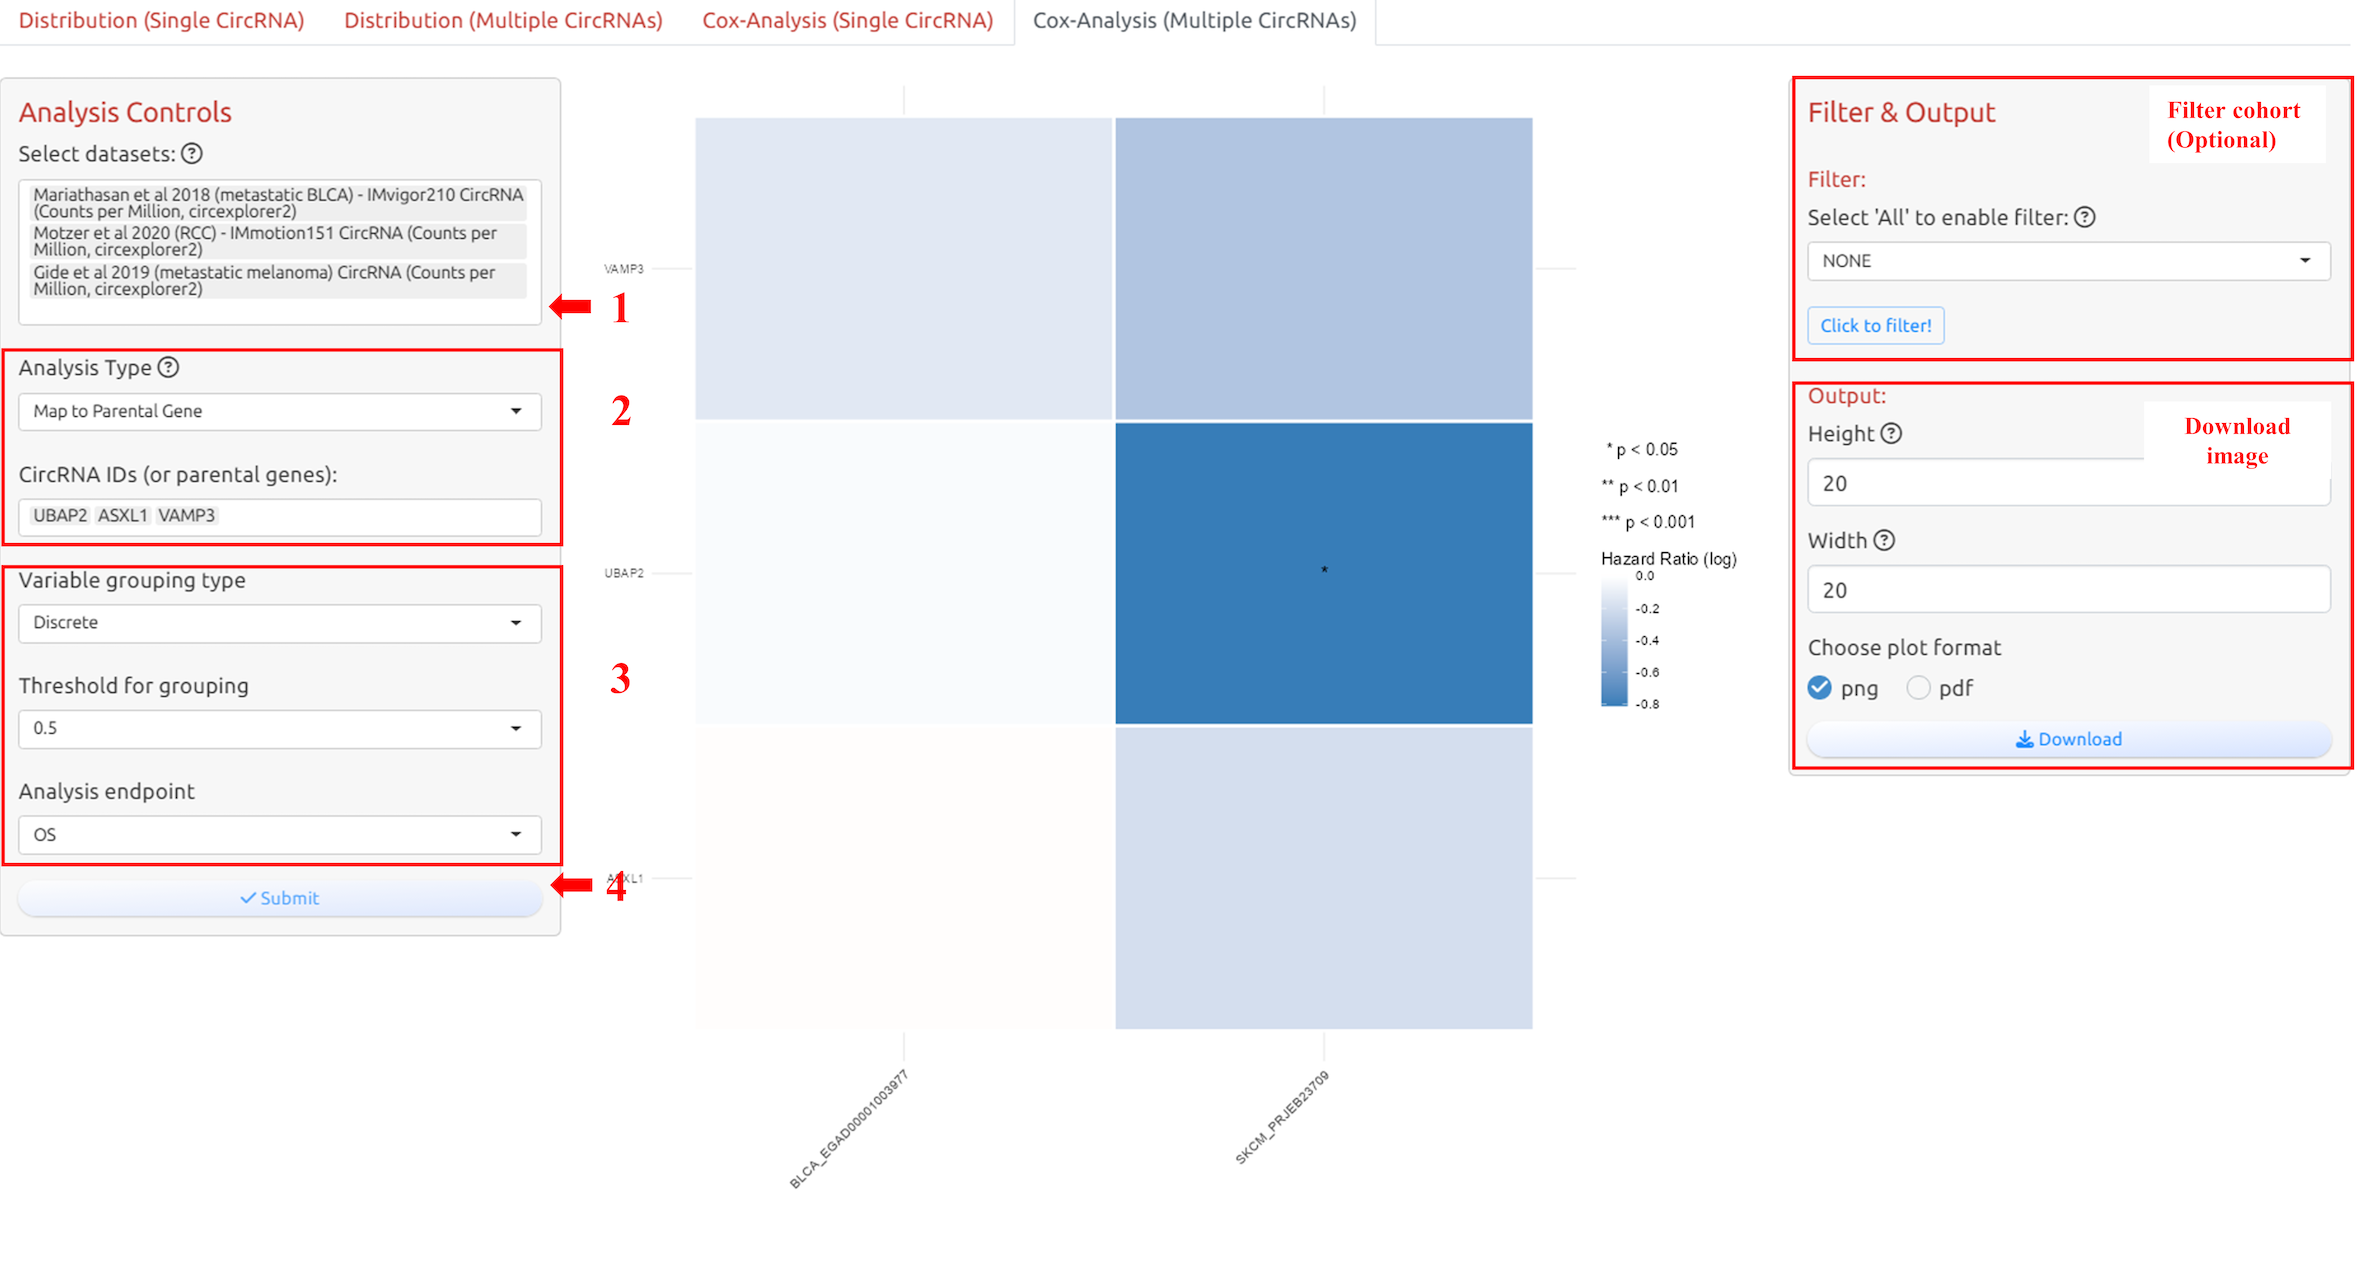
1. Select datasets
2. Select circRNA-ID(s) or Host Gene(s) of the circRNA-ID(s)
3. Adjust parameters for analysis
4. Submit the analysis
5. Signature Page
5.1 Overview
This module provides functionality for visualizing the correlation between one or more CircRNAs and tumor microenvironment measures or immune signatures in one or more cohorts. All selectable datasets are obtained from cohorts that you choose on the ‘Repository’ page.
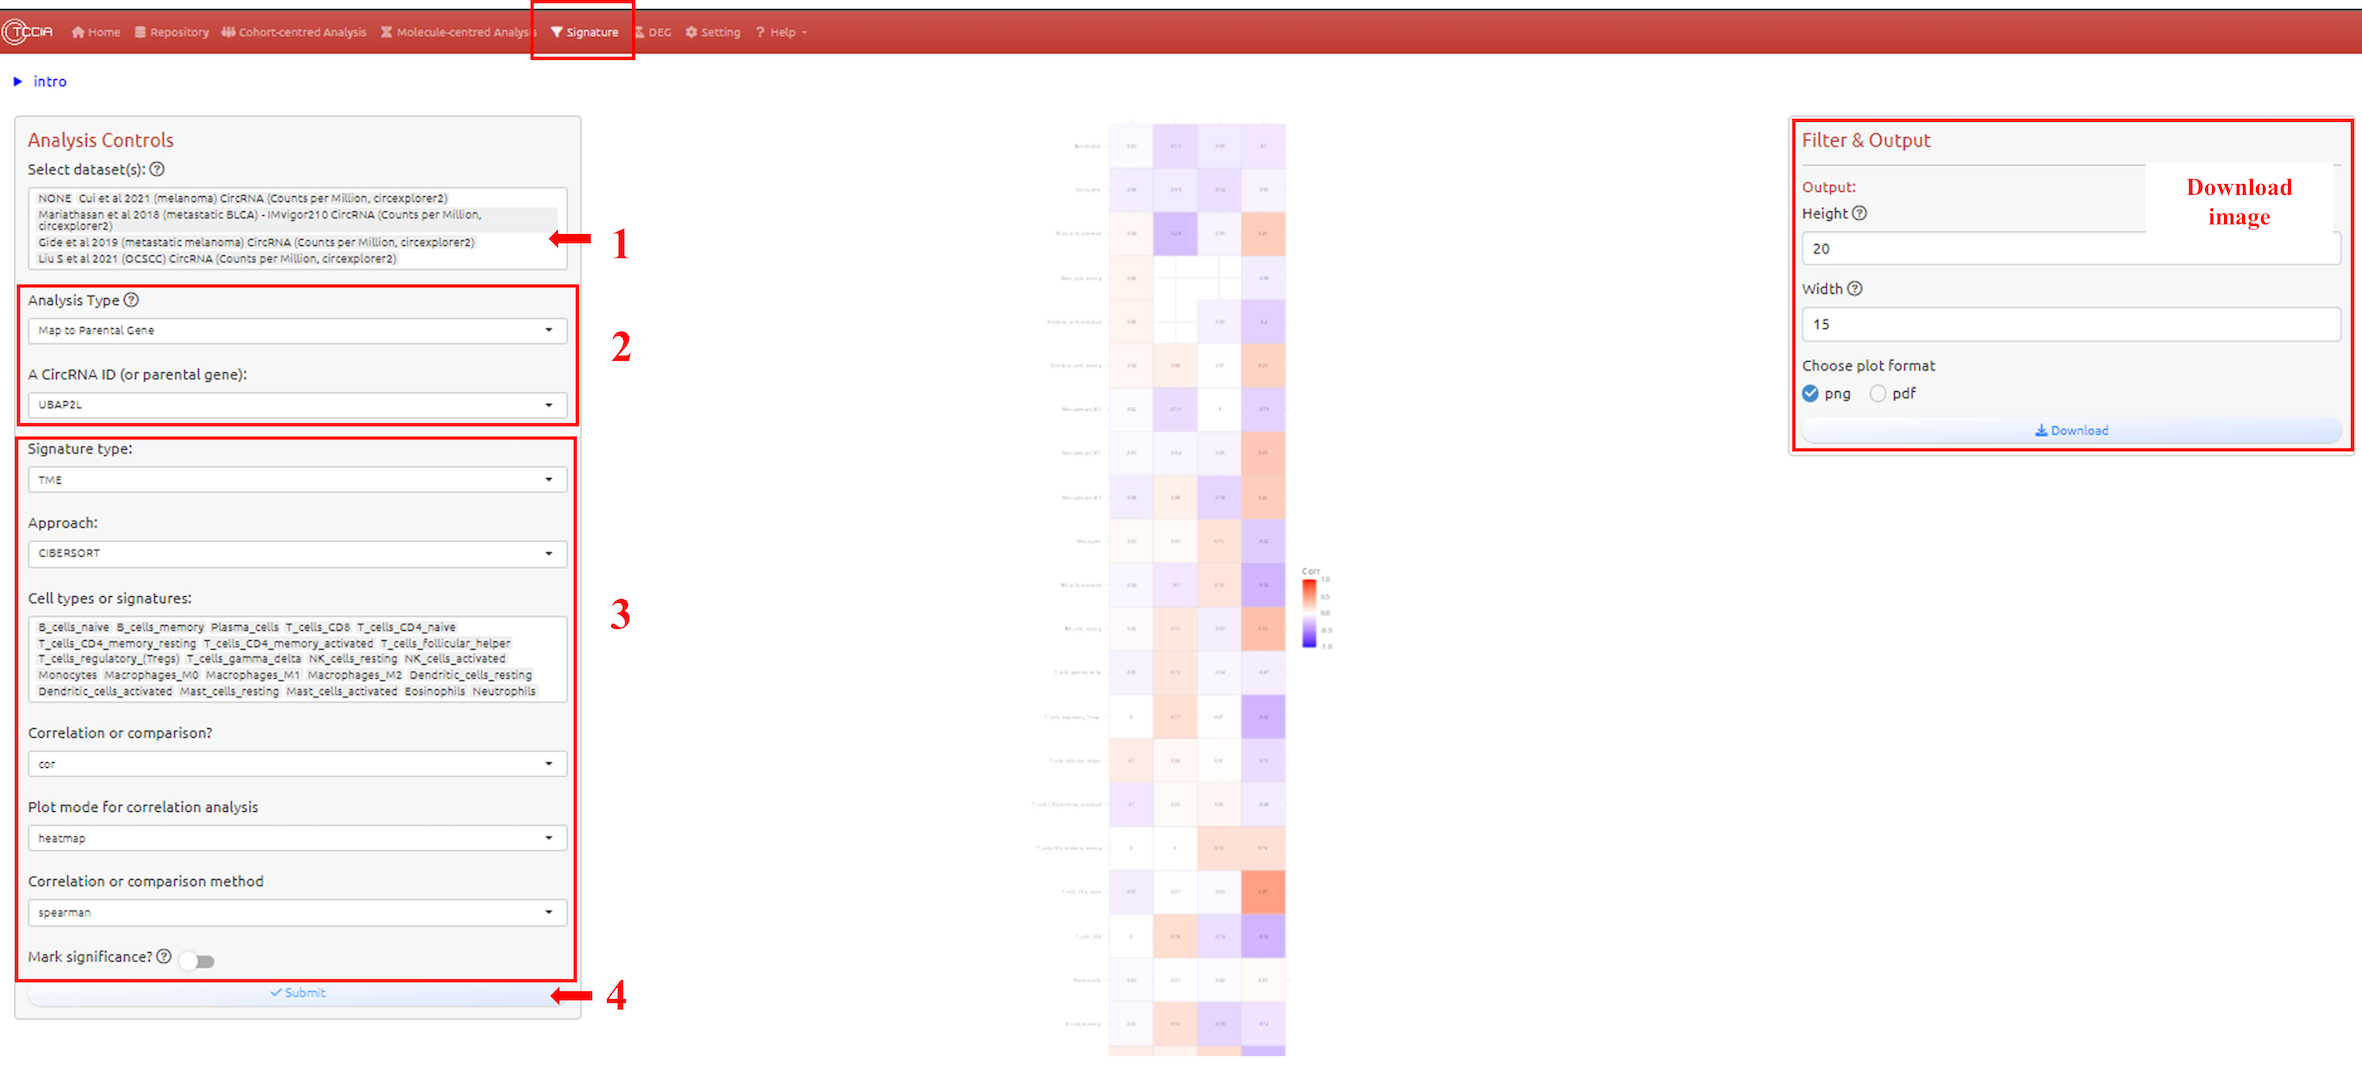
1. Select datasets
2. Select circRNA-ID or Host Gene of the circRNA-ID
3. Adjust parameters for analysis
4. Submit the analysis
6. DE circRNAs Page
6.1 Overview
This module provides functionality for viewing the differential expression CircRNA list for immunotherapy responsive and non-responsive patients, and displaying the data through a volcano plot. All selectable cohorts are obtained from the ‘Repository’ page.
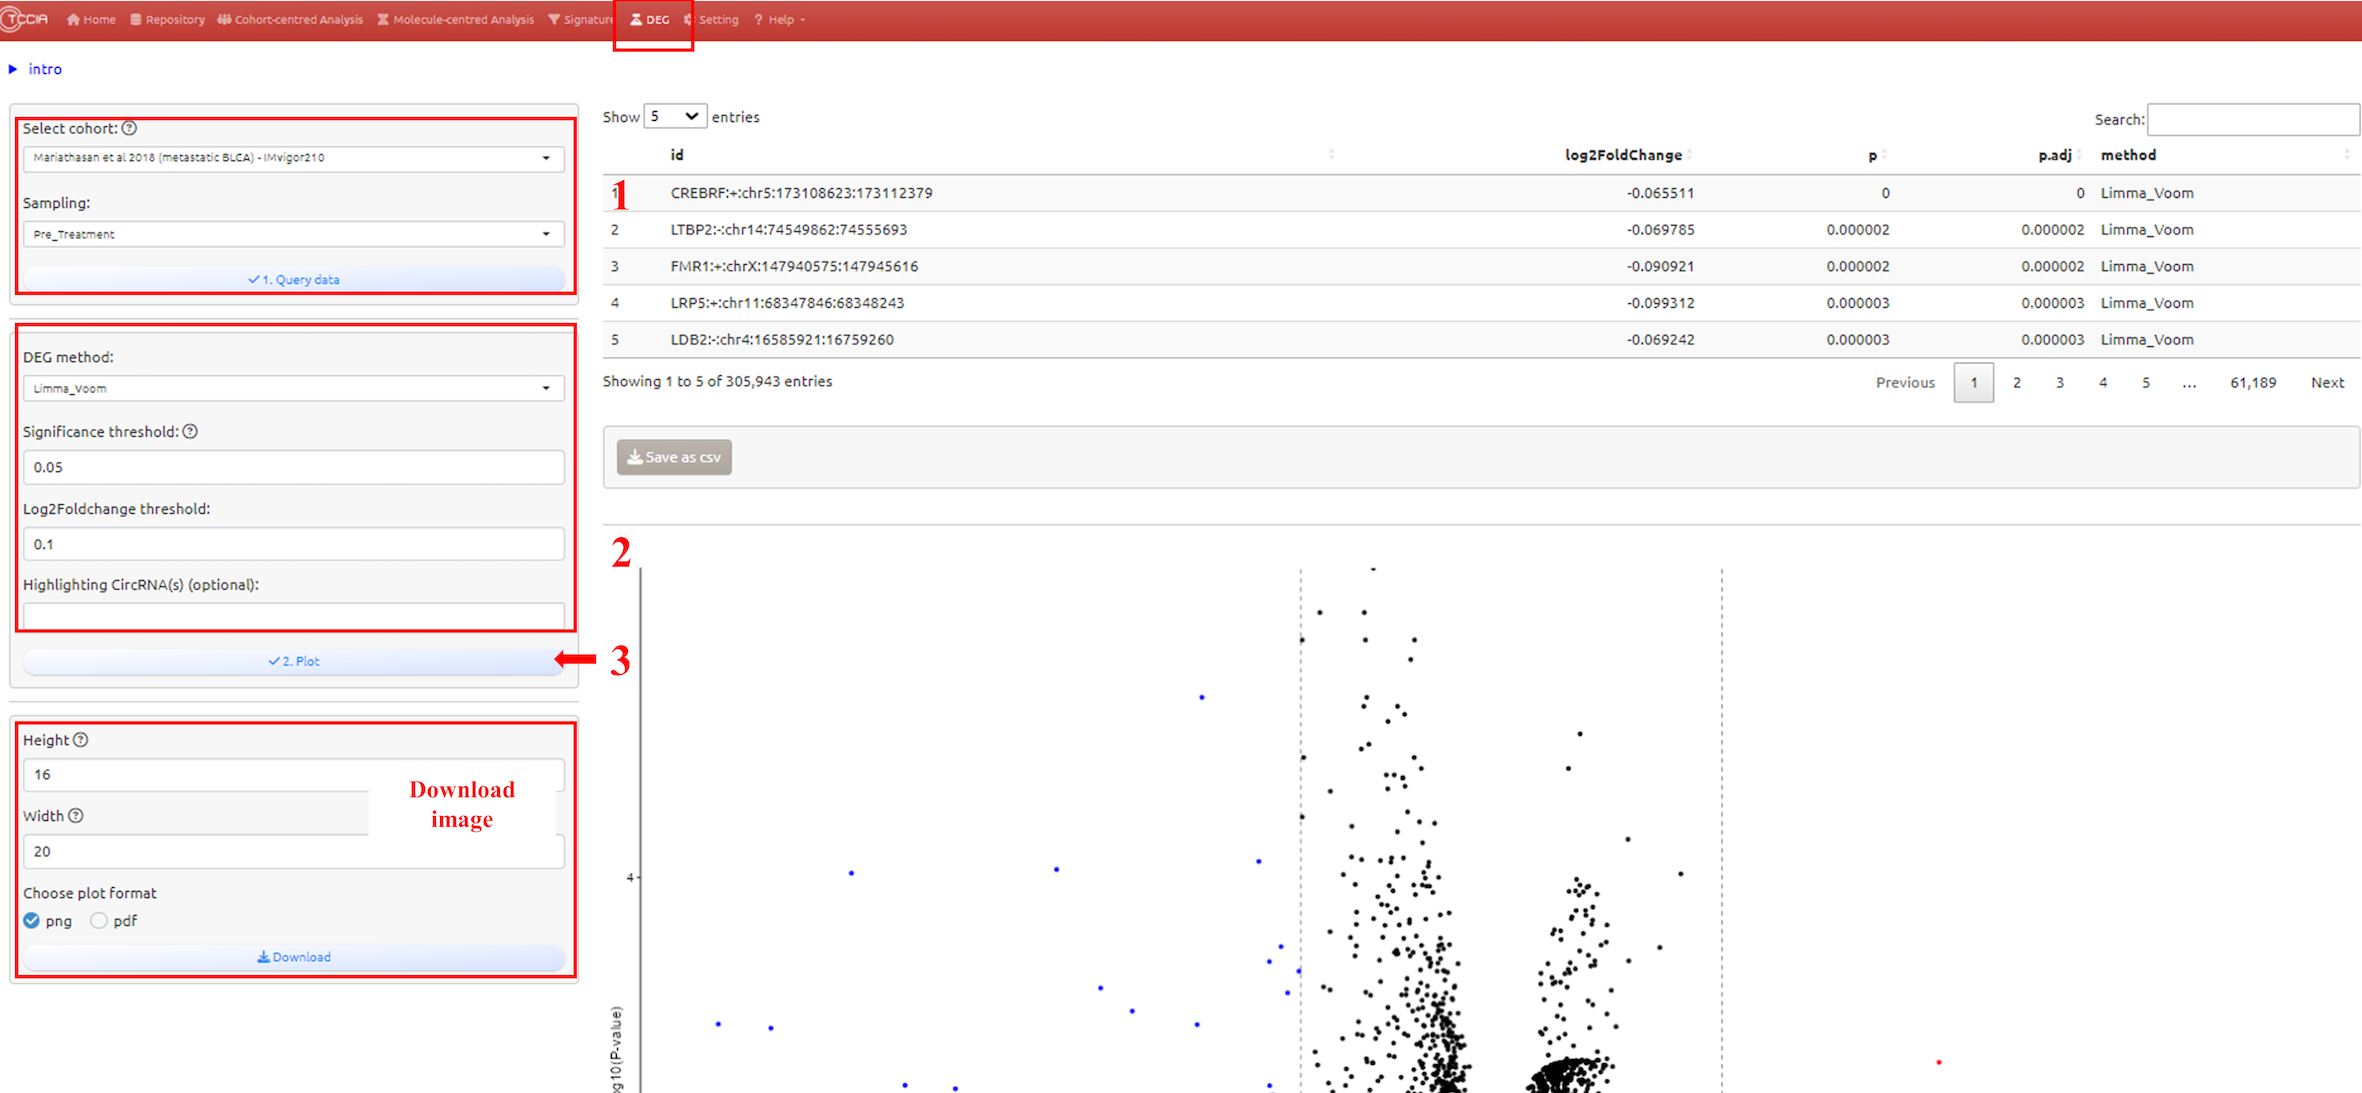
1. Select datasets
2. Adjust parameters for analysis
3. Submit the analysis
7. Global Setting Page
This page provides global options for controlling access to underlying data. By setting default options, we try to minimize the user’s initial learning cost and ensure that the results displayed on the website are biologically meaningful. For example, we only analyze sample data related to immunotherapy by default, in order to match the core goals of our website, and to remove data bias (confusion caused by different treatments in the data) that first-time users may not see. In addition, we have set up default configuration for CircRNA expression using appropriate CPM quantification. Users can adjust these global options according to their own needs after becoming familiar with the website, in order to facilitate exploring more possibilities of this website.
Data Availability
All the processed data can be accessed on the TCCIA website. We collected ICB-related cancer data sets with tumor gene expression profiles from the dbGaP, EGA, EMBL-EBI and GSA databases. Following the accession instruction described in published ICB studies (table on the “Repository” page), we downloaded ICB patients’ RNA-Seq raw sequencing data, clinical information, and response outcome information from ICB studies (if available). Curated circRNA identification results are available at Zenodo (https://zenodo.org/doi/10.5281/zenodo.7969298). For requesting circRNA expression matrix or other types of data, please contact the leader, Jian-Guo Zhou.
CircRNA and Host Gene
A number of host genes of circRNAs play oncogenic or suppressive role in tumorigenesis. circRNAs are derived from these genes and regulate the transcription, translation, parental protein activity and degradation of their host genes.
CircRNA identification and differential expression analysis
We employed multiple circRNA detection tools, including CIRCexplorer2, CIRIquant, find_circ, and circRNA_finder, to identify, parse, and annotate circRNA junctions within each sample, using the human genome version hg38 as the reference. In our pursuit of biologically robust circRNA identification within each cohort, we undertook an approach that amalgamated results from various circRNA detection tools and implemented a rigorous ensemble strategy (label as ‘Ensemble’ in the selection) characterized by the following stringent criteria. Firstly, we exclusively retained circRNAs located on chromosomes 1 to 22, as well as the X and Y chromosomes. Secondly, circRNAs were mandated to exhibit genomic overlap with gene regions as defined in the reference genome annotation file, specifically “gencode.v34.annotation.gtf.” Lastly, to ensure heightened robustness, circRNAs had to be concurrently identified by a minimum of two out of the four employed detection tools, with at least one of these tools detecting no fewer than two back-splicing junction counts. This meticulous methodological approach was instrumental in ensuring the acquisition of biologically sound and reliable circRNA datasets, thereby fortifying the integrity of our analysis within each cohort. Subsequently, the back-splicing junction counts underwent differential expression analysis using established approaches, namely Limma Voom, edgeR, and DESeq2. This analysis facilitated comparisons between patient groups, such as those who responded to checkpoint immunotherapy versus non-responders, as well as between samples collected before and during ICB treatment.
Response and Response2
We gathered and processed patient ‘Response’ data from various cohorts. However, due to inconsistencies among these cohorts, such as the usage of different terms like CR, PR, SD, PD, R, NR, DCB, and NDB, we harmonized the response variable based on the timing of treatment and treatment response. As a result, we introduced a new variable called ‘Response2’ with four distinct categories: Pre-R, Pre-NR, On-R, and On-NR. In cases where response data was not available, we assigned the category NE.
Cancer Type Abbreviation
| Abbr. | Description |
| :—————– | :———————————————————– | | BLCA | Bladder urothelial carcinoma | | SKCM | Skin cutaneous melanoma | | KIRC | Kidney renal clear cell carcinoma | | HNSC | Head and neck squamous cell carcinoma |
| NSCLC | Non-small cell lung cancer, including lung adenocarcinoma and lung squamous cell carcinoma | | SCLC | Small cell lung cancer | | SARC | Sarcoma | | BRCA | Breast cancer | | SGC | Salivary gland cancer |
Citation
Please cite the following article when you used TCCIA in your study:
Shixiang Wang#, Yi Xiong#, Yihao Zhang#, Haitao Wang, Jianfeng Li, Minjun Chen, Peng Luo, Yung-Hung Luo, Markus Hecht, Benjamin Frey, Udo S Gaipl, Xuejun Li*, Qi Zhao*, Hu Ma*, Jian-Guo Zhou*. TCCIA: A Comprehensive Resource for Exploring CircRNA in Cancer Immunotherapy. Journal for ImmunoTherapy of Cancer (2024);12:e008040. doi: 10.1136/jitc-2023-008040.
Contact
If you find any bug or have any feature to request, please report it by email (Shixiang Wang mailto:shixiang1994wang@gmail.com, Jianguo Zhou mailto:jianguo.zhou@zmu.edu.cn).