Options:
1.File Upload
2.Tracks and Radius
3.Position
4.Multiplot and Example Download
5.Color Regulation
Plot Result:
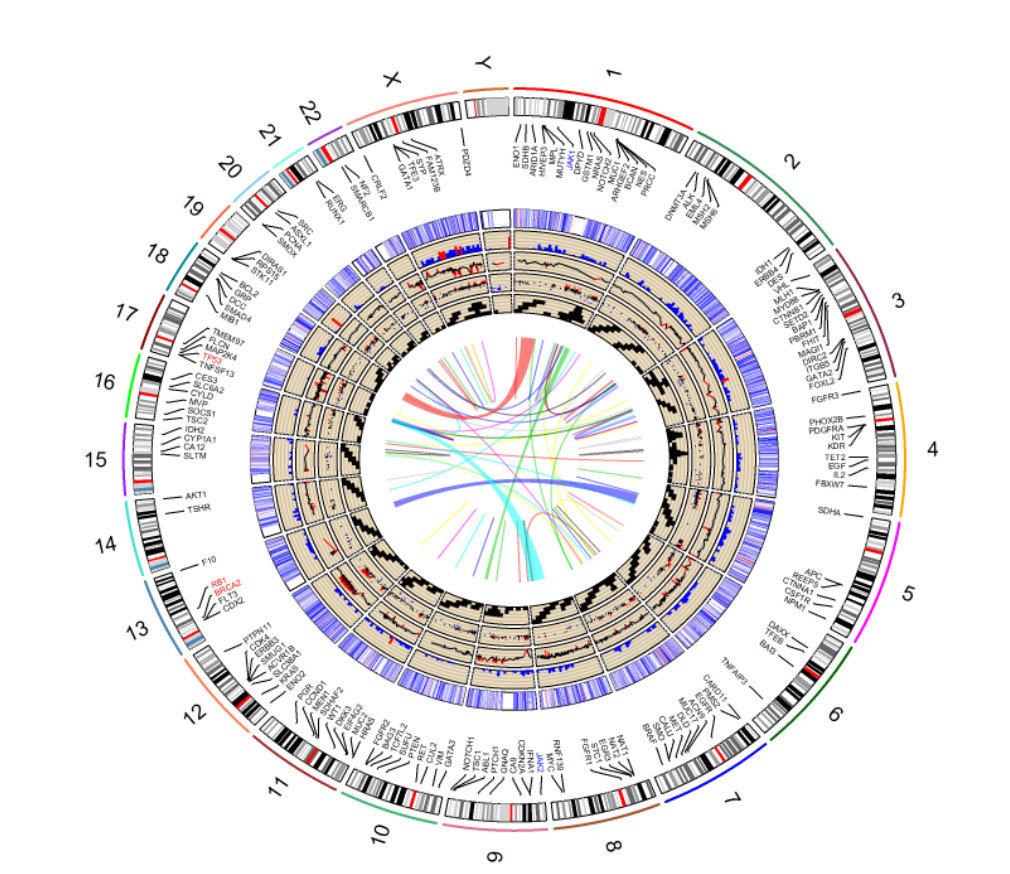
1.Example Plot
2.Current Plot
1.Chrom Data
2.Heatmap Data
3.Histogram Data
4.Scatter Data
5.Tile Data
6.Ribbon Data
7.Link Data
Author Information
1.Shinyapps developer
Application: Genomic chromosome data visualization application
Language: R language
Author: benben-miao
Maintainer: benben-miao
Author Email: benben.miao@outlook.com
Author Github: benben-miao
Dev Time: 2019/10/08
Dev IDE: Rstudio
Deploy Host: Shinyapps.io
2.Reference
Package name: RCircos
Version: 1.2.0
Author: Hongen Zhang
Maintainer: Hongen Zhang <hzhang.henry@gmail.com>
Description: A simple and flexible way to generate Circos 2D track plot images for genomic data visualization is implemented in this package.
The types of plots include: heatmap, histogram, lines, scatterplot, tiles and plot items for further decorations include connector,
link (lines and ribbons), and text (gene) label.
All functions require only R graphics package that comes with R base installation.
License: GPL (>=2)
Depends: R (>= 2.10)
3.Application
App name: Genomic chromosome data visualization application
Code program: R language.
code Env: R 3.6.0
Deplement Packages: shiny, shinydashborad, readxl, RCircos, colourpicker,DT
Deploy Host: Shinyapps.io
Author Information
