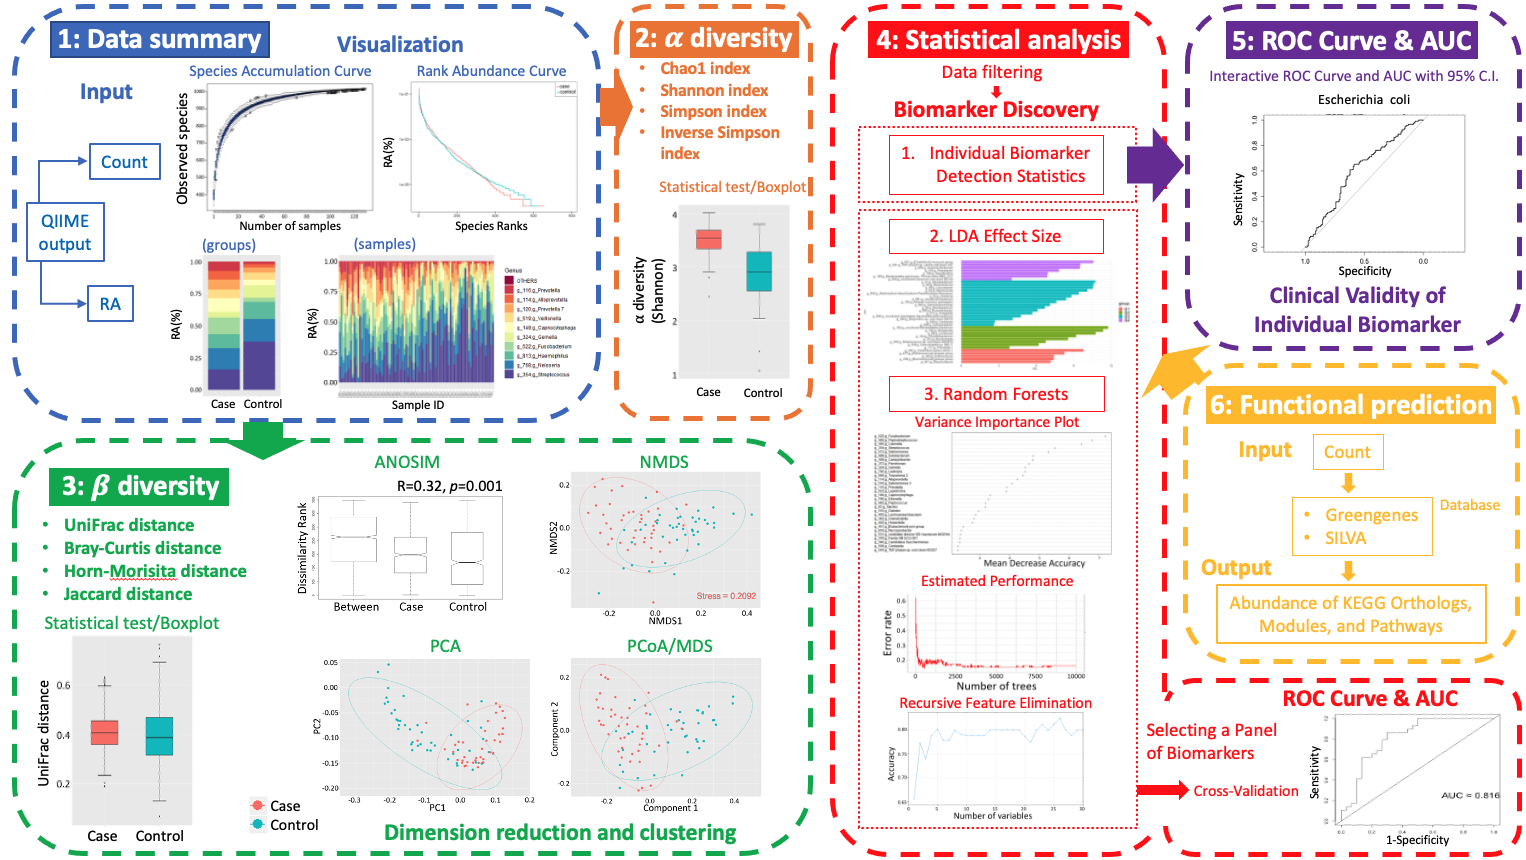
wiSDOM (web-based inclusionary analysis Suite for Disease-Oriented Metagenomics) is a browser-based R Shiny graphical user interface (GUI) for scientists without programming expertise to conduct analysis and visualization of metagenomic data which comprises six functional modules: (1) Initial visualization of sampling effort and distribution of dominant bacterial taxa among groups or individual samples at different taxonomic levels; (2) Statis-tical and visual analysis of α diversity; (3) Analysis of similarity (ANOSIM) of β diversity on Bray-Curtis or UniFrac distance and visualizations; (4) Microbial biomarker discovery between two or more groups with various statistical and machine learning approaches; (5) Assessment of the clini-cal validity of selected biomarkers by creating the receiver operating characteristic (ROC) curves and calculating the area under the curve (AUC) for binary classifiers; and lastly (6) Functional pre-diction of metagenomes with PICRUSt or Tax4Fun.
wiSDOM is available for running locally at github repository, and browser-based R Shiny interface. For detailed inplementation of each module, please refer to our tutorials with toy examples .
wiSDOM is developed and maintained by Dr. Lun-Ching Chang from the Department of Mathematical Sciences, Florida Atlantic University.
For question and bug report, please email Dr. Lun-Ching Chang (changl@fau.edu) or leave your comment and reporting issue at github page .
How to start the software
First, we recommend users to use R >= 4.0.2 and Shiny >= 1.2.0 to execute wiSDOM locally. If you are using earlier R version, you may encounter errors in installing packages, then please update your R version frist
For Windows or MACs, users need to run the following command in R to install the shiny package
install.packages('shiny')
library(shiny)
shiny::runGitHub('wiSDOM','lunching')
How to cite
If you find wiSDOM useful in your research please city our paper
Will add citation upon publication